Full Report
The numbers behind Yatsen Holding Limited: as-reported financial statements and company metrics for FY2021–FY2025, traced to the source filings, opened with the share-price history those statements have to justify. Every linked figure opens the exact page of the filing it was printed on, with the statement row highlighted. Amounts in RMB thousands unless noted.
Reading notes: All figures are as printed in the Form 20-F consolidated financial statements in RMB thousands (the filings show a supplemental US$ convenience-translation column at the latest-year rate, which is not used here). Each fiscal year is cited to that year's own Form 20-F, where it appears as the latest reported column (income statement and cash flow print three years; the balance sheet prints two). FY2019 and FY2020 (long-term record only) are comparative columns of the FY2021 Form 20-F. Revenue is disaggregated by reportable segment (Color Cosmetics Brands, Skincare Brands, Others), the company's own product-category cut introduced in the FY2022 20-F and applied retrospectively; the FY2021 20-F had a single reportable segment and only disaggregated revenue by sales channel, so FY2021 segment figures are cited to the FY2022 20-F.
Share Price — Available History Since March 2026
The stock closed at $3.43 on Jul 28, 2026 — down 12% over the window shown, trading between $2.19 and $3.89.
Source: market price feed, daily closes, Mar 2026–Jul 2026 — the feed marks this available history as partial. Price return only, excludes dividends.
FY2025 at a Glance
Revenue (RMB thousands)
Diluted EPS
Source: FY2025 consolidated statements [1] [2] [3] [4]. Click any linked figure to open the filing page with the row highlighted.
Net Revenues by Segment (Product Category)
| Net Revenues by Segment (Product Category) | FY2021 | FY2022 | FY2023 | FY2024 | FY2025 |
|---|---|---|---|---|---|
| Color Cosmetics Brands | 4,869,279 | 2,415,500 | 1,973,726 | 1,968,350 | 2,005,911 |
| Skincare Brands | 855,241 | 1,241,528 | 1,383,578 | 1,393,259 | 2,277,334 |
| Others | 115,453 | 49,094 | 57,470 | 31,805 | 14,879 |
| Total net revenues | 5,839,973 | 3,706,122 | 3,414,774 | 3,393,414 | 4,298,124 |
| Total net revenues growth, derived | — | -36.5% | -7.9% | -0.6% | +26.7% |
Source: Note 25 — Segment Information (net revenues by reportable segment). FY2021 is cited to the FY2022 20-F, the earliest filing that reports the retrospectively-adjusted segment split. [5] [6] [7] [8]. Click any linked figure to open the filing page with the row highlighted.
Income Statement
| Income Statement | FY2021 | FY2022 | FY2023 | FY2024 | FY2025 | FY2026E | FY2027E |
|---|---|---|---|---|---|---|---|
| Total net revenues | 5,839,973 | 3,706,122 | 3,414,774 | 3,393,414 | 4,298,124 | 5,238,000 | 5,733,000 |
| Total cost of revenues | (1,941,177) | (1,187,370) | (901,455) | (776,236) | (936,780) | — | — |
| Gross profit | 3,898,796 | 2,518,752 | 2,513,319 | 2,617,178 | 3,361,344 | — | — |
| Selling and marketing expenses | (4,005,589) | (2,330,480) | (2,230,974) | (2,268,793) | (2,852,288) | — | — |
| General and administrative expenses | (941,347) | (720,409) | (500,942) | (444,373) | (303,628) | — | — |
| Research and development expenses | (142,086) | (126,875) | (111,698) | (109,287) | (137,296) | — | — |
| Impairment of goodwill | — | — | (354,039) | (403,076) | 0 | — | — |
| Total operating expenses | (5,523,040) | (3,447,650) | (3,426,674) | (3,442,069) | (3,547,138) | — | — |
| Loss from operations | (1,624,244) | (928,898) | (913,355) | (824,891) | (185,794) | — | — |
| Loss before income tax expenses | (1,547,959) | (818,628) | (753,437) | (713,307) | (92,522) | — | — |
| Net loss | (1,547,038) | (821,333) | (750,227) | (710,221) | (92,414) | — | — |
| Net loss attributable to the Yatsen Holding Limited's shareholders | (1,540,734) | (815,371) | (747,763) | (708,174) | (80,868) | — | — |
| Net loss per ordinary share-diluted | (0.61) | (0.34) | (0.34) | (0.35) | (0.04) | 1.56 | 3.01 |
| Total net revenues growth, derived | — | -36.5% | -7.9% | -0.6% | +26.7% | +21.9% | +9.5% |
Source: Consolidated Statements of Operations [1] [2] [3] [4]. Click any linked figure to open the filing page with the row highlighted.
Columns marked E are consensus analyst estimates from S&P Capital IQ (CapIQ), shown alongside reported results for direct comparison; they are not company guidance.
Estimate source: S&P Capital IQ (CapIQ) consensus, as of 2026-07-29. Estimate figures are S&P Capital IQ consensus (vendor data — no filing page links). EPS and net income use the normalized (adjusted) consensus where the street reports it. Line-item analyst models (segments, drivers, KPIs) are in the Visible Alpha tab.
Balance Sheet
| Balance Sheet | FY2021 | FY2022 | FY2023 | FY2024 | FY2025 |
|---|---|---|---|---|---|
| Cash and cash equivalents | 3,138,008 | 1,512,945 | 836,888 | 817,395 | 765,379 |
| Short-term investments | — | 1,072,867 | 1,218,481 | 539,130 | 246,008 |
| Accounts receivable, net | 355,837 | 200,843 | 198,851 | 214,558 | 220,870 |
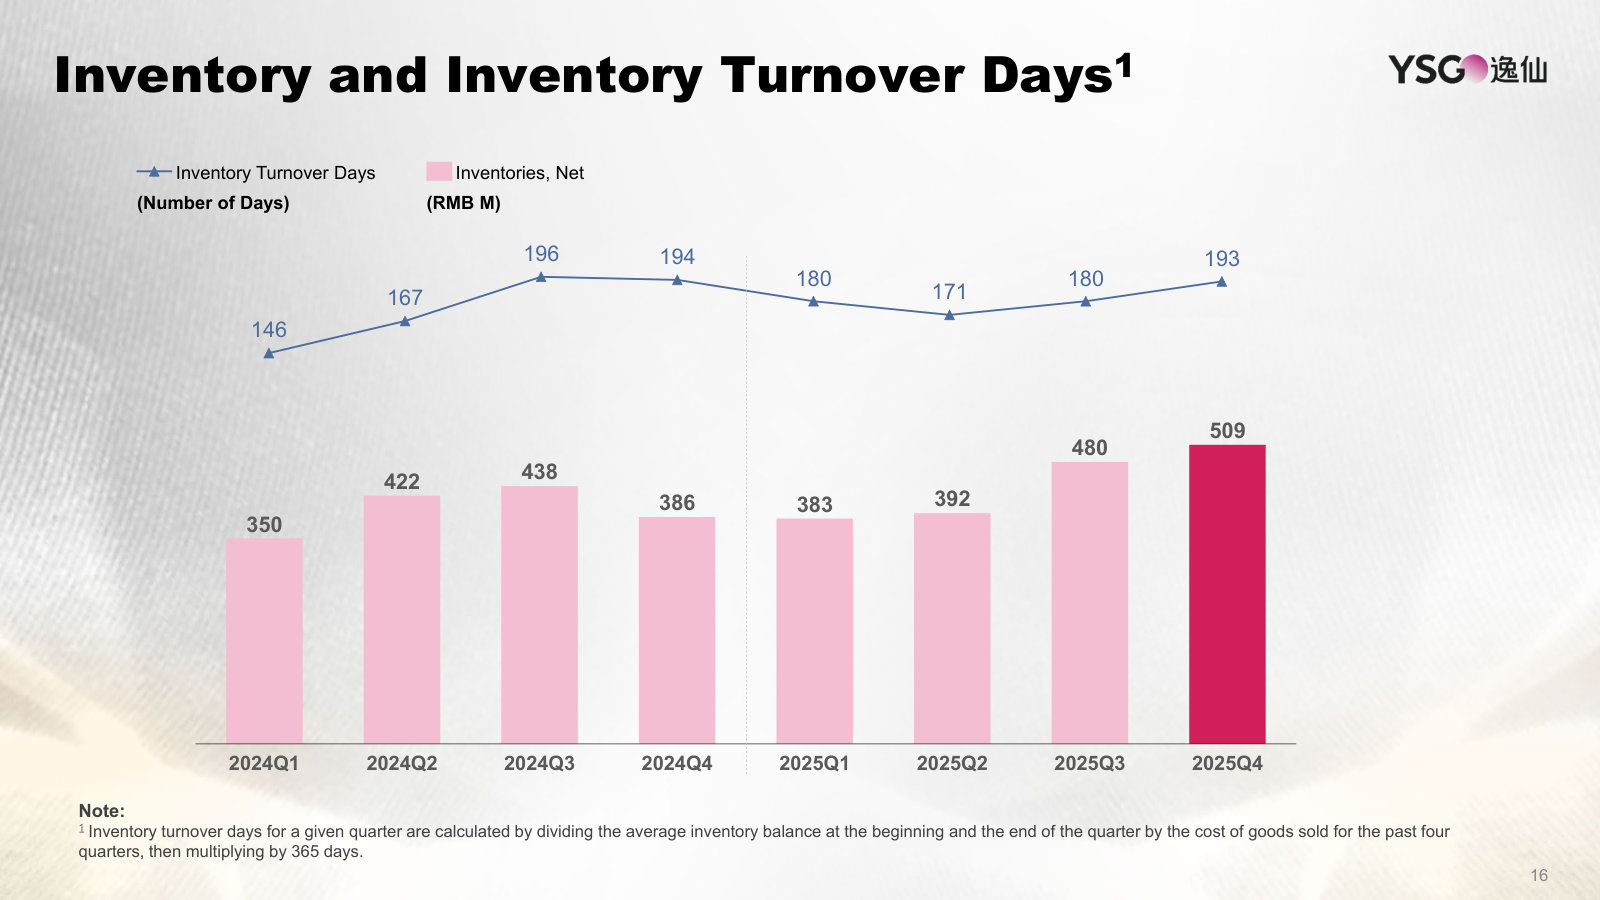
| Inventories, net | 695,761 | 423,287 | 352,090 | 386,054 | 508,730 |
| Total current assets | 4,555,857 | 3,508,421 | 2,951,599 | 2,347,654 | 2,234,188 |
| Investments | 350,380 | 502,579 | 618,752 | 664,579 | 653,560 |
| Goodwill, net | 869,421 | 857,145 | 556,567 | 155,029 | 155,029 |
| Intangible assets, net | 745,851 | 689,669 | 671,396 | 559,708 | 537,509 |
| Total assets | 7,272,009 | 5,862,656 | 5,006,015 | 3,970,867 | 3,846,982 |
| Total current liabilities | 877,583 | 588,412 | 611,328 | 640,188 | 615,279 |
| Total liabilities | 1,264,516 | 800,130 | 821,242 | 867,852 | 846,342 |
| Total Yatsen Holding Limited shareholders' equity | 5,659,188 | 4,719,442 | 4,135,037 | 3,055,326 | 3,010,604 |
| Total shareholders' equity | 5,668,906 | 4,722,602 | 4,133,307 | 3,052,031 | 2,999,303 |
Source: Consolidated Balance Sheets [9] [10] [11] [12]. Click any linked figure to open the filing page with the row highlighted.
Cash Flow
| Cash Flow | FY2021 | FY2022 | FY2023 | FY2024 | FY2025 |
|---|---|---|---|---|---|
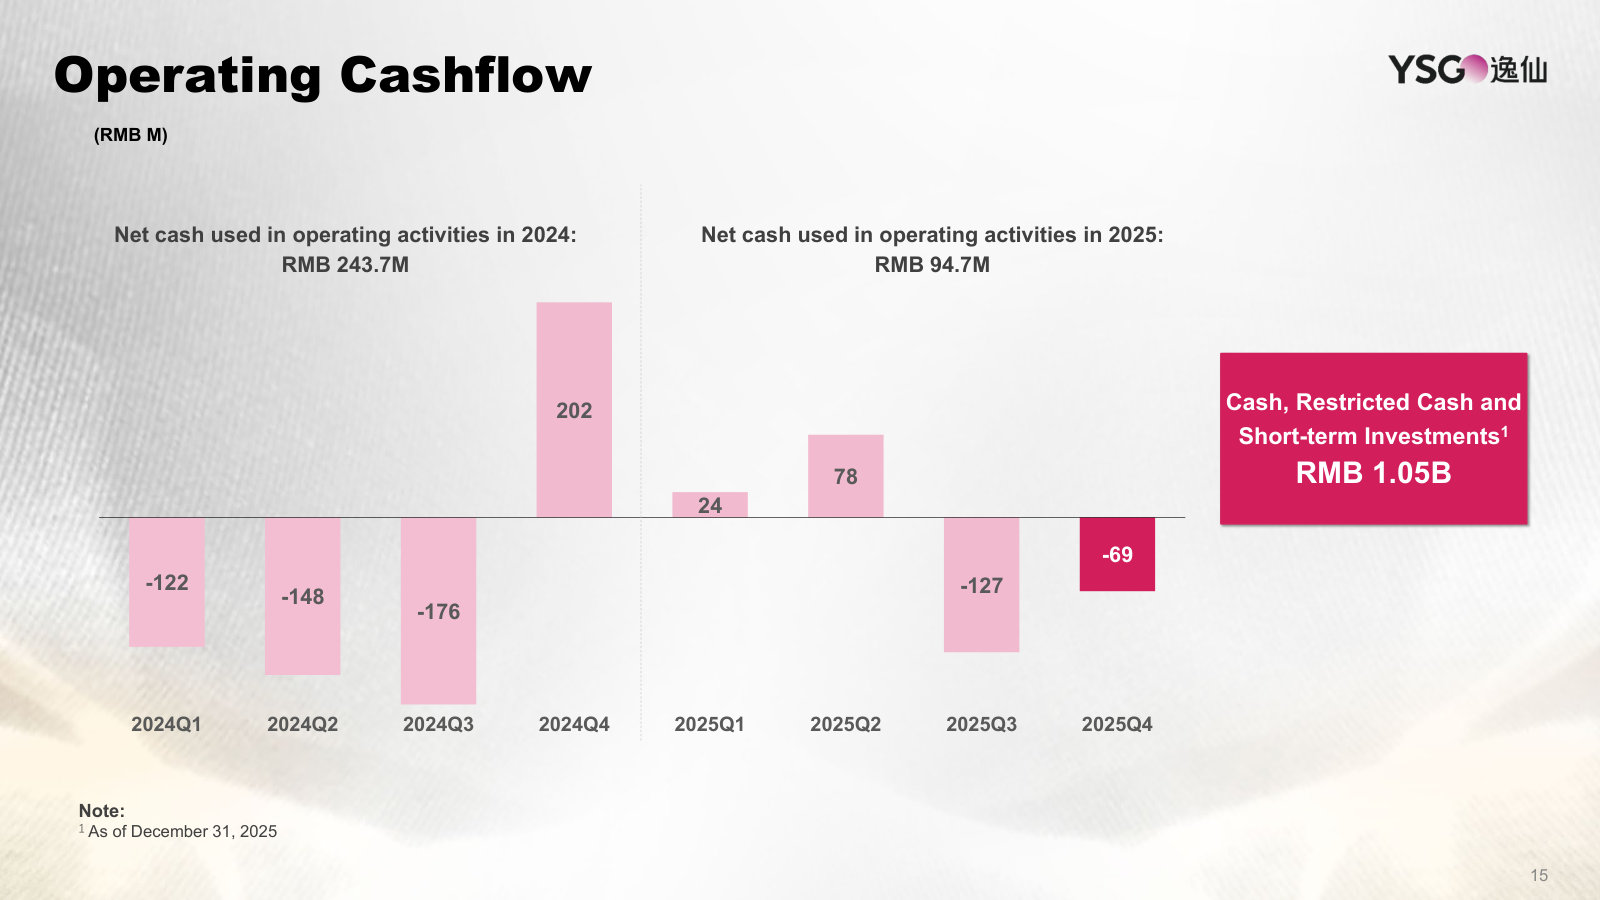
| Net cash provided by (used in) operating activities | (1,020,441) | 136,208 | (107,442) | (243,666) | (94,663) |
| Share-based compensation | 530,440 | 340,860 | 77,502 | 91,174 | 59,031 |
| Purchases of property and equipment | (141,433) | (50,778) | (43,648) | (52,740) | (42,065) |
| Purchases of intangible assets | (25,304) | (8,550) | (321) | (4,280) | (1,735) |
| Acquisition of businesses, net of cash and cash equivalents acquired | (989,652) | (2,107) | 0 | 0 | — |
| Net cash used in investing activities | (1,484,257) | (1,155,416) | (260,487) | 592,123 | 246,794 |
| Repurchases of ordinary shares | (15,161) | (654,650) | (212,693) | (405,792) | (111,019) |
| Net cash used in financing activities | (1,706) | (654,450) | (342,455) | (394,226) | (151,445) |
| Net (decrease) increase in cash and cash equivalents and restricted cash | (2,595,384) | (1,583,680) | (696,192) | (40,741) | (9,899) |
| Cash and cash equivalents and restricted cash at the end of the year | 3,138,008 | 1,554,328 | 858,136 | 817,395 | 807,496 |
| Free cash flow, derived | (1,161,874) | 85,430 | (151,090) | (296,406) | (136,728) |
Source: Consolidated Statements of Cash Flows [13] [14] [15] [16]. Click any linked figure to open the filing page with the row highlighted.
Sales Channel Product Mix
| Sales Channel Product Mix | FY2021 | FY2022 | FY2023 | FY2024 | FY2025 |
|---|---|---|---|---|---|
| DTC channels as % of total net revenues | 83.5% | 84.9% | 84.6% | 82.9% | 84.9% |
| Sales to distributors as % of net revenues | — | 14.7% | 15.1% | 16.9% | 14.9% |
| Skincare Brands as % of net revenues | — | 33.5% | 40.5% | 41.1% | 53.0% |
| Color Cosmetics Brands as % of net revenues | — | — | 57.8% | 58.0% | 46.7% |
Source: company filings [17] [18] [19] [20]. Click any linked figure to open the filing page with the row highlighted.
Operating Cost Ratios (% of net revenues)
| Operating Cost Ratios (% of net revenues) | FY2021 | FY2022 | FY2023 | FY2024 | FY2025 |
|---|---|---|---|---|---|
| Gross margin | 66.8% | 68.0% | 73.6% | 77.1% | 78.2% |
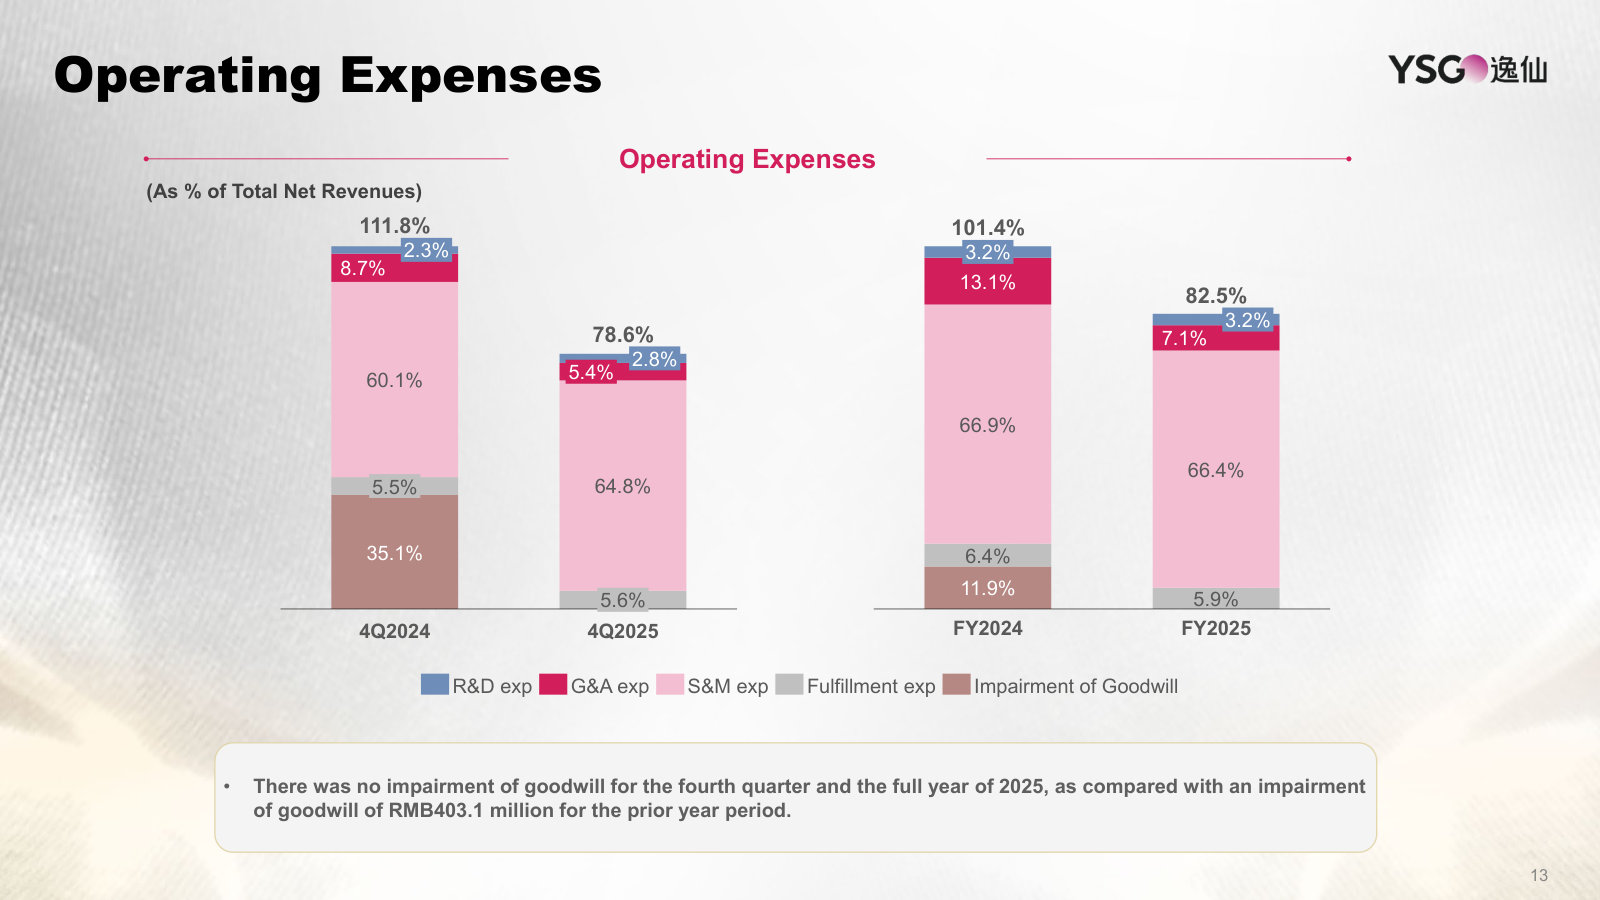
| Selling and marketing expenses as % of net revenues | 68.6% | 62.9% | 65.3% | 66.9% | 66.3% |
| General and administrative expenses as % of net revenues | 16.1% | 19.4% | 14.7% | 13.1% | 7.1% |
| Fulfilment expenses as % of net revenues | 7.4% | 7.3% | 6.7% | 6.4% | 5.9% |
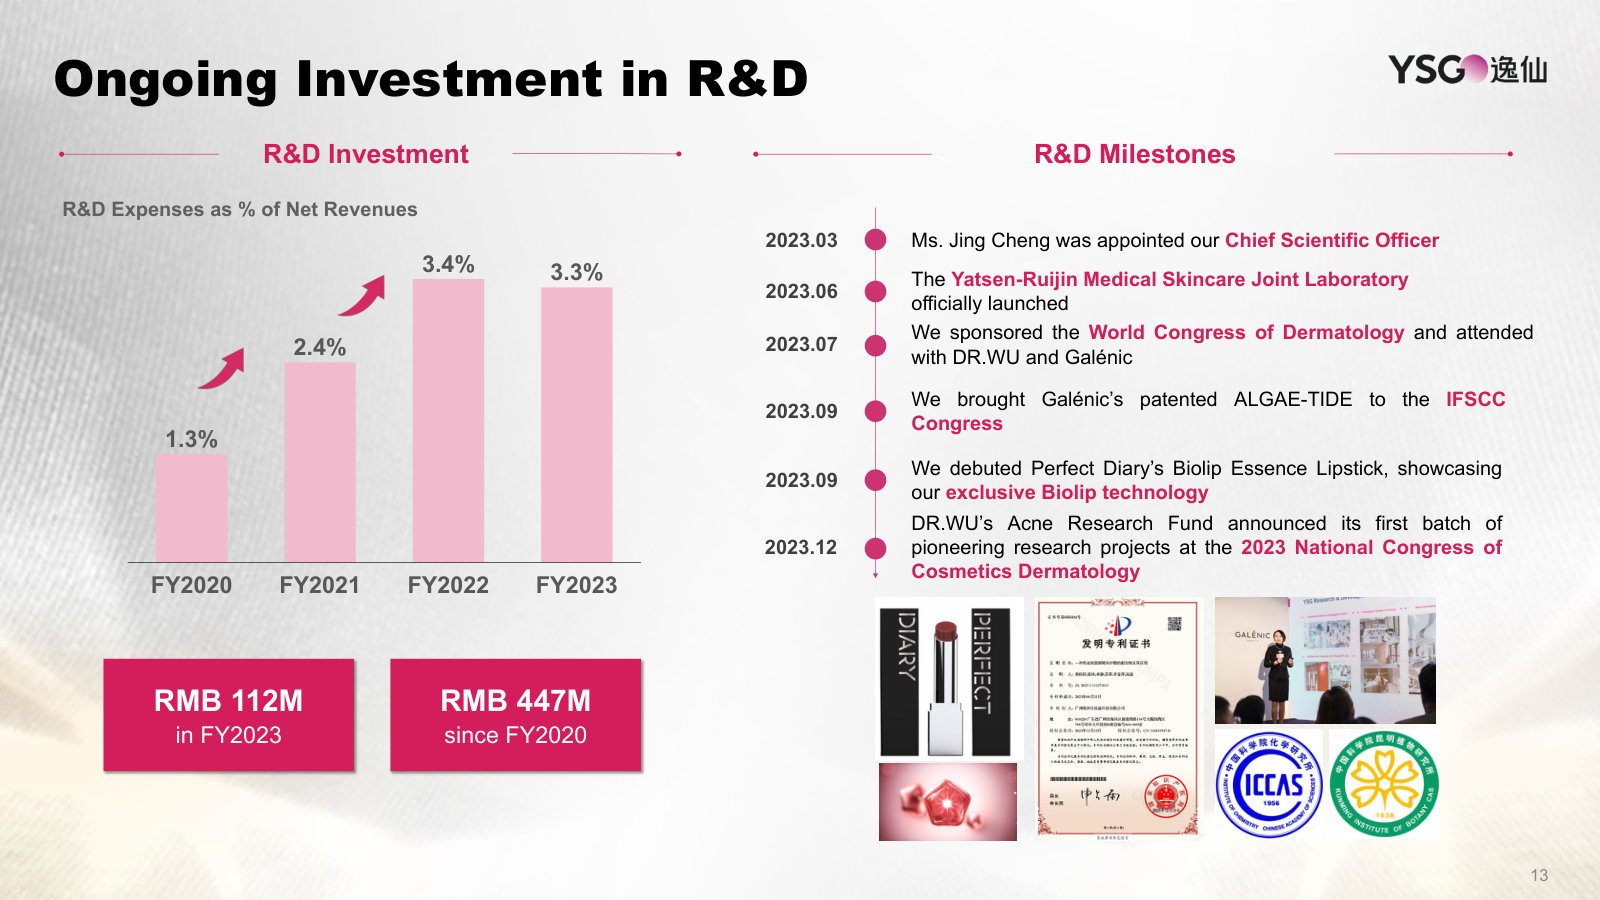
| Research and development expenses as % of net revenues | 2.4% | 3.4% | 3.3% | 3.2% | 3.2% |
Source: company filings [21] [22] [23] [24]. Click any linked figure to open the filing page with the row highlighted.
Scale Footprint
| Scale Footprint | FY2021 | FY2022 | FY2023 | FY2024 | FY2025 |
|---|---|---|---|---|---|
| Offline experience stores (period-end) | 294 | 164 | 114 | 88 | 77 |
| Full-time employees (period-end) | 3,497 | 1,837 | 1,505 | 1,350 | 1,623 |
| Registered patents (cumulative, period-end) | 118 | 174 | — | 245 | 269 |
Source: company filings [25] [22] [23] [26]. Click any linked figure to open the filing page with the row highlighted.
Long-Term Record
| Fiscal year | Total net revenues | Loss from operations | Net loss attributable to the Yatsen Holding Limited's shareholders | Net loss per ordinary share-diluted | Net cash provided by (used in) operating activities |
|---|---|---|---|---|---|
| FY2019 | 3,031,167 | 143,761 | 75,359 | (0.10) | (6,179) |
| FY2020 | 5,233,170 | (2,682,671) | (2,687,807) | (4.78) | (983,368) |
| FY2021 | 5,839,973 | (1,624,244) | (1,540,734) | (0.61) | (1,020,441) |
| FY2022 | 3,706,122 | (928,898) | (815,371) | (0.34) | 136,208 |
| FY2023 | 3,414,774 | (913,355) | (747,763) | (0.34) | (107,442) |
| FY2024 | 3,393,414 | (824,891) | (708,174) | (0.35) | (243,666) |
| FY2025 | 4,298,124 | (185,794) | (80,868) | (0.04) | (94,663) |
Source: consolidated statements across filings; older years from the standardized feed [13] [1] [15] [2]. Click any linked figure to open the filing page with the row highlighted.
Analyst Consensus
Mean target
Median target
High target
Low target
Street ratings: 1 strong buy. Consensus: Strong Buy.
Estimate source: S&P Capital IQ (CapIQ) consensus, as of 2026-07-29. Estimate figures are S&P Capital IQ consensus (vendor data — no filing page links). EPS and net income use the normalized (adjusted) consensus where the street reports it. Line-item analyst models (segments, drivers, KPIs) are in the Visible Alpha tab.
Traceability
283 of 286 figures on this page (99%) link to the filing page where they are printed — click a linked figure to open the source PDF at that page with the row highlighted. Unlinked figures come from standardized data feeds or pre-filing years.
All figures are as printed in the Form 20-F consolidated financial statements in RMB thousands (the filings show a supplemental US$ convenience-translation column at the latest-year rate, which is not used here).
Each fiscal year is cited to that year's own Form 20-F, where it appears as the latest reported column (income statement and cash flow print three years; the balance sheet prints two).
FY2019 and FY2020 (long-term record only) are comparative columns of the FY2021 Form 20-F.
Revenue is disaggregated by reportable segment (Color Cosmetics Brands, Skincare Brands, Others), the company's own product-category cut introduced in the FY2022 20-F and applied retrospectively; the FY2021 20-F had a single reportable segment and only disaggregated revenue by sales channel, so FY2021 segment figures are cited to the FY2022 20-F.
Impairment of goodwill is a distinct income-statement line only in FY2023 (RMB354,039) and FY2024 (RMB403,076); it is nil in FY2025 and was not a separate line in FY2021–FY2022.
Yatsen carries essentially no interest-bearing debt across the period, so no borrowings line is shown; liquidity is held in cash, short-term investments and long-term investments.
The numeric feed (data/financials/*.json, source yfinance) is labelled 'USD' but its values are as-reported RMB in full units (e.g. FY2025 revenue 4,298,124,000 = RMB4,298,124 thousand); it standardises operating income to exclude goodwill impairment — see discrepancies.
2 figure(s) differed between the data feed and the filing; the filing value is shown (see the run's metrics/metrics_tab.json for the audit trail).
Yatsen Holding Limited's management explains the business in its own materials. The slides below do the most of that work, pulled from the documents preserved in Sources. Each source link opens the complete presentation at that slide in a new tab.
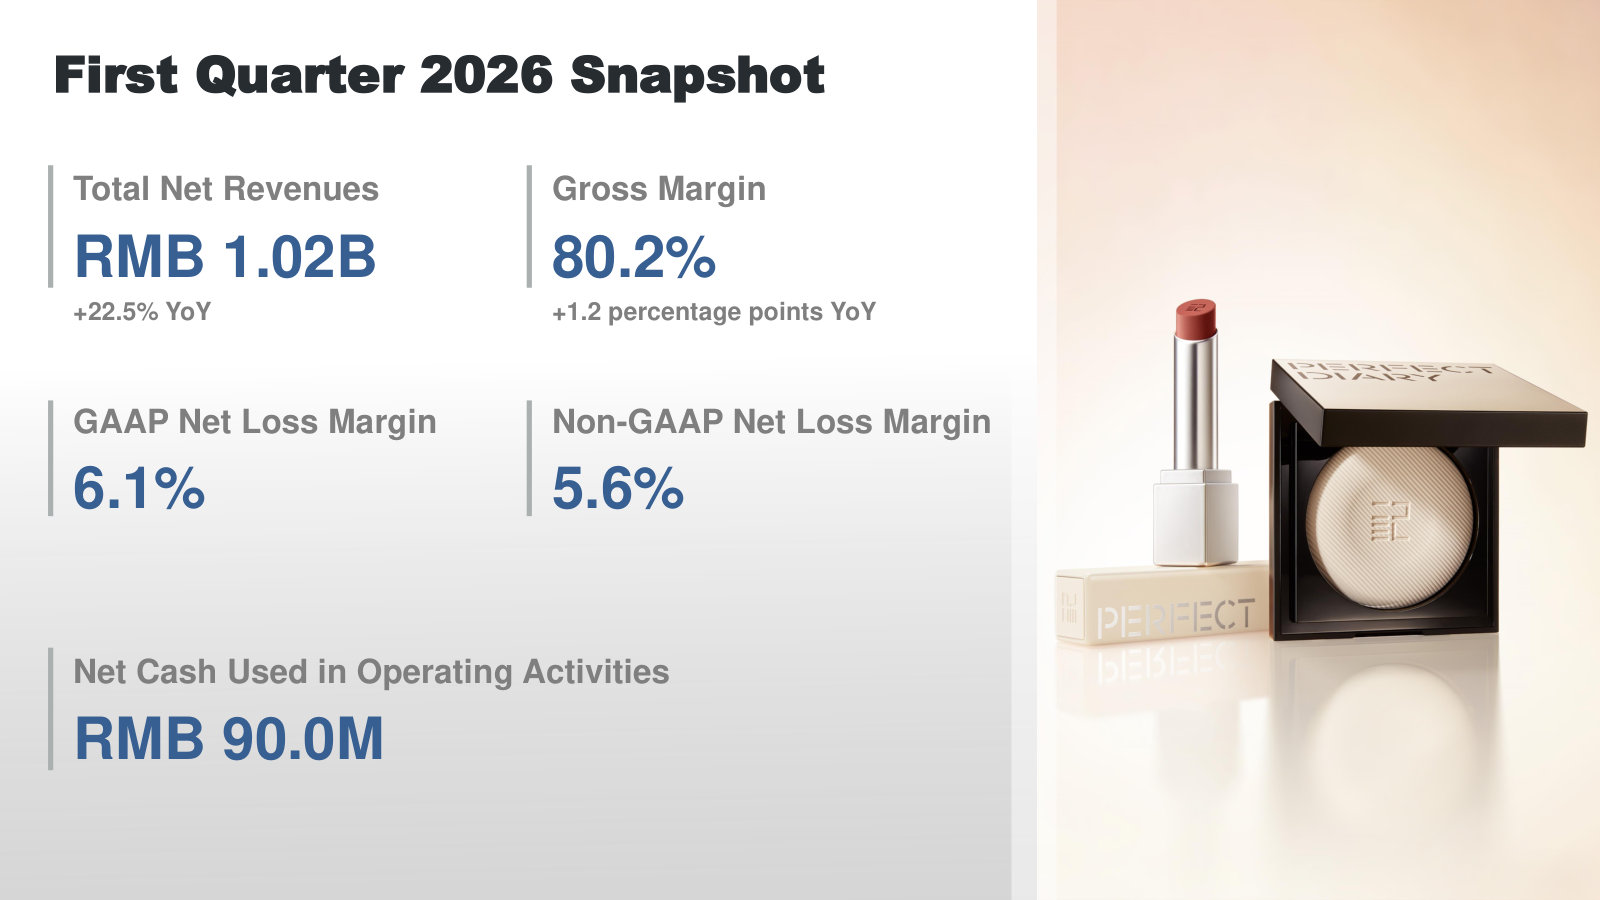
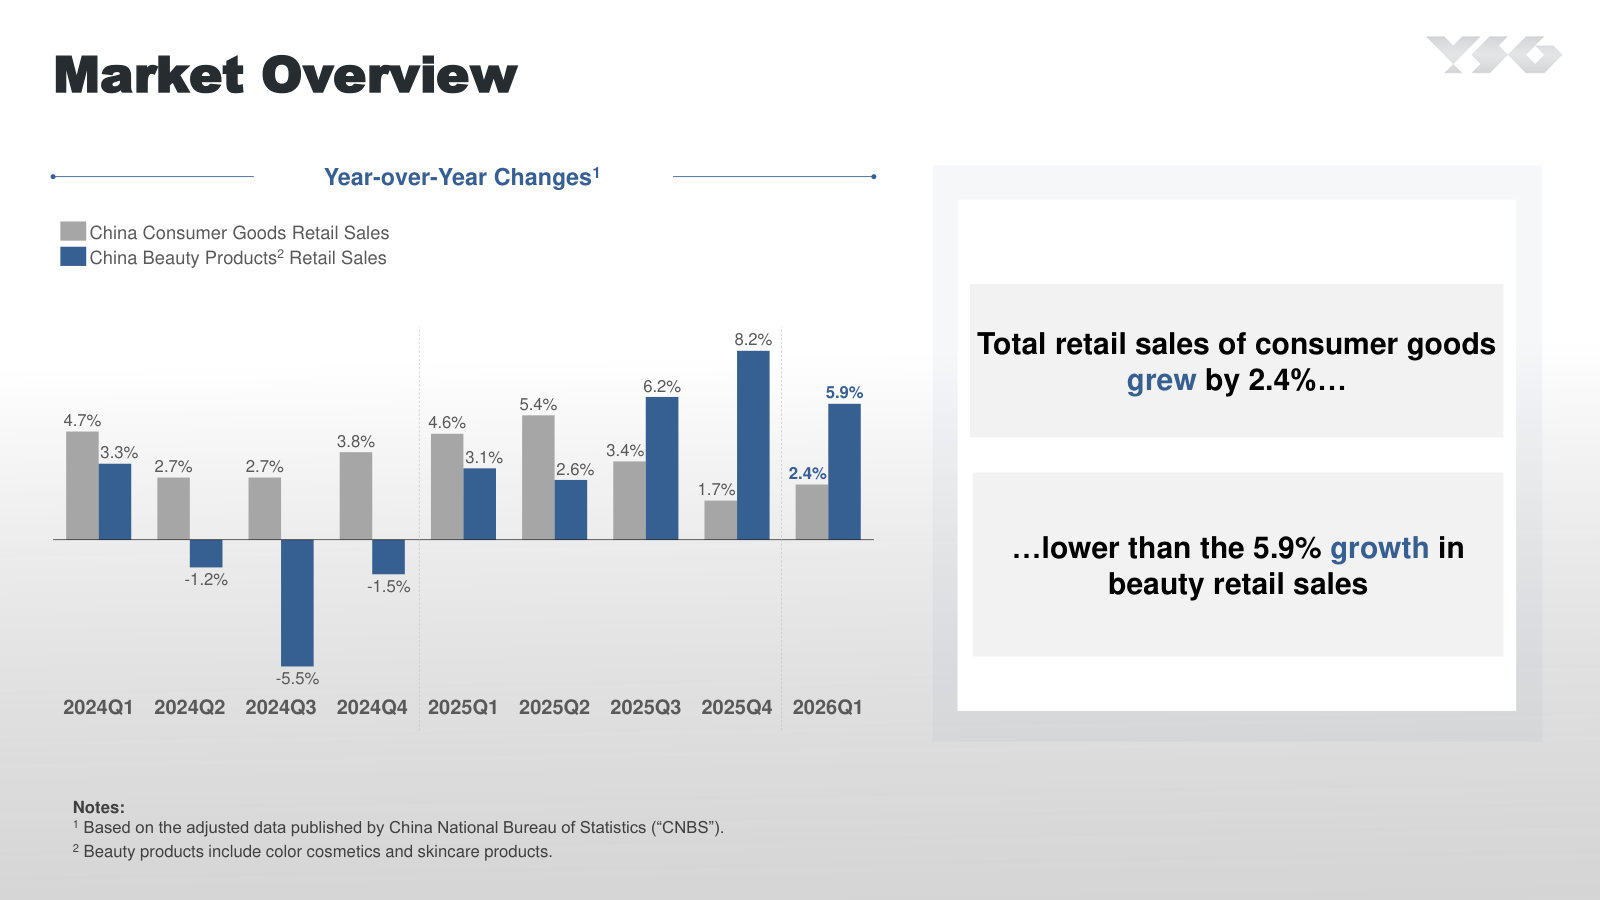
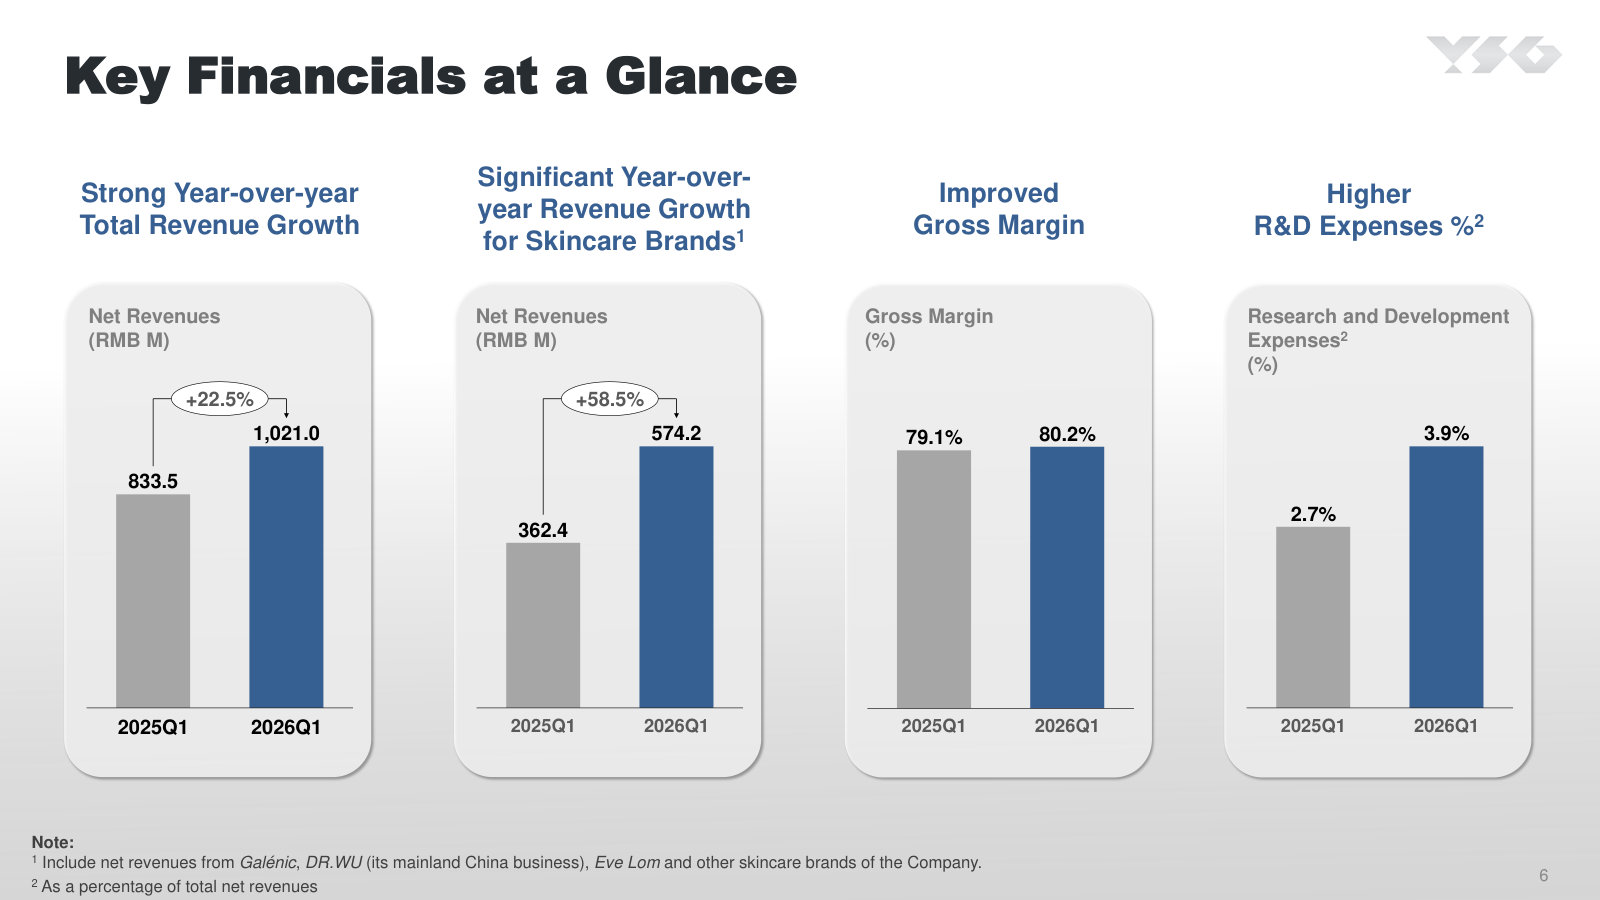
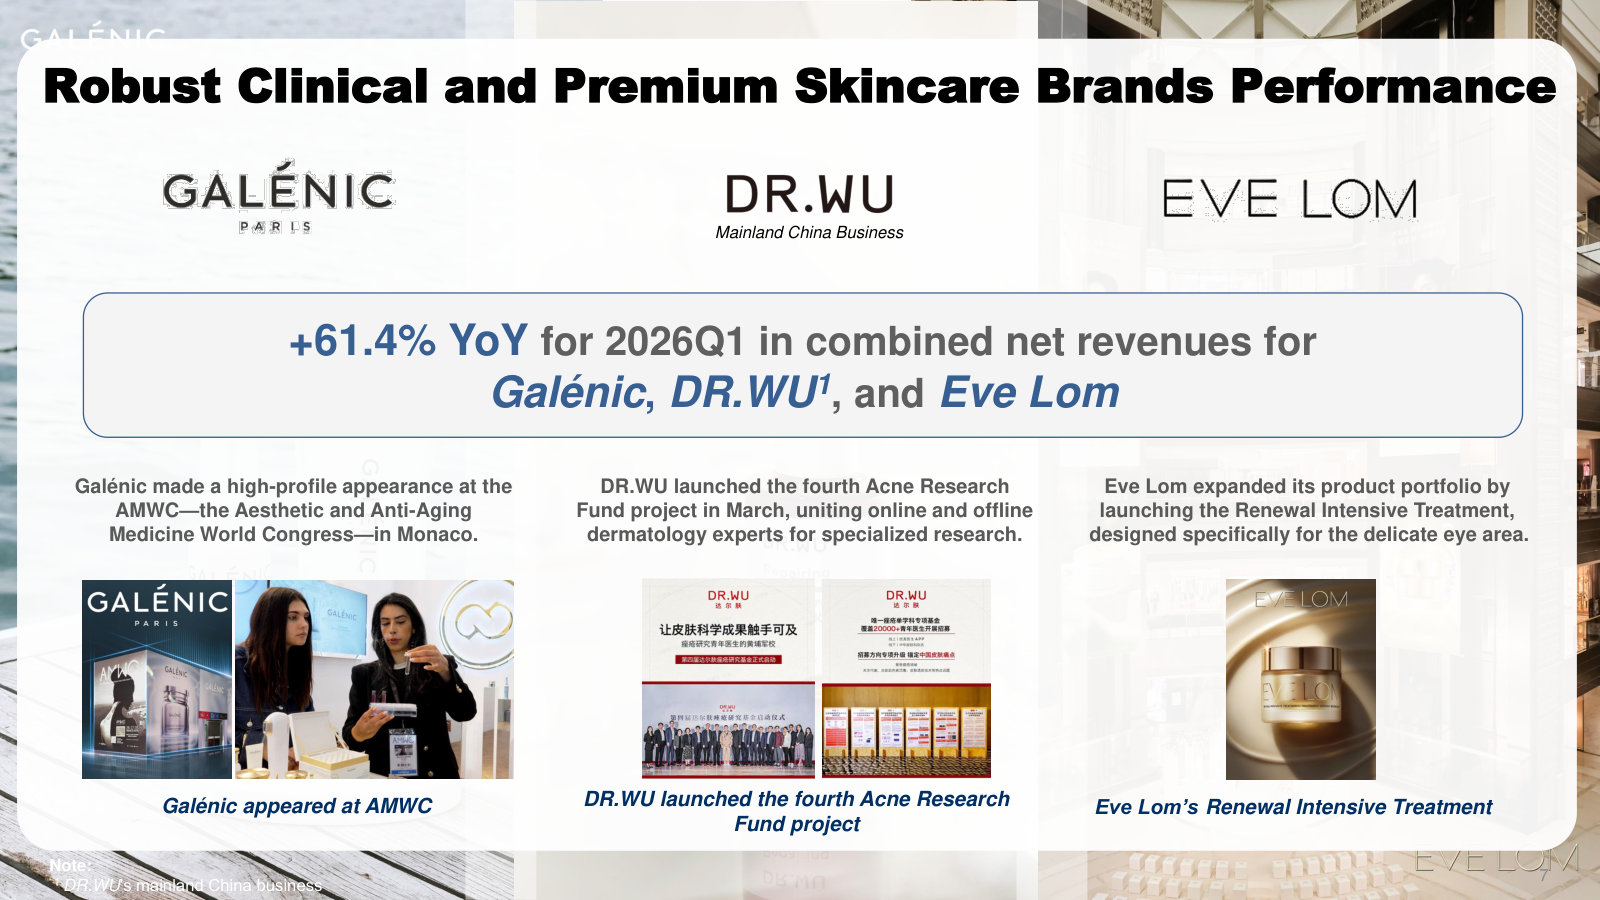
First Quarter 2026 Investor Presentation — 1Q2026
The most recent quarter: where revenue growth, margins and the skincare shift stand right now, in four clean charts. · Open the full document →
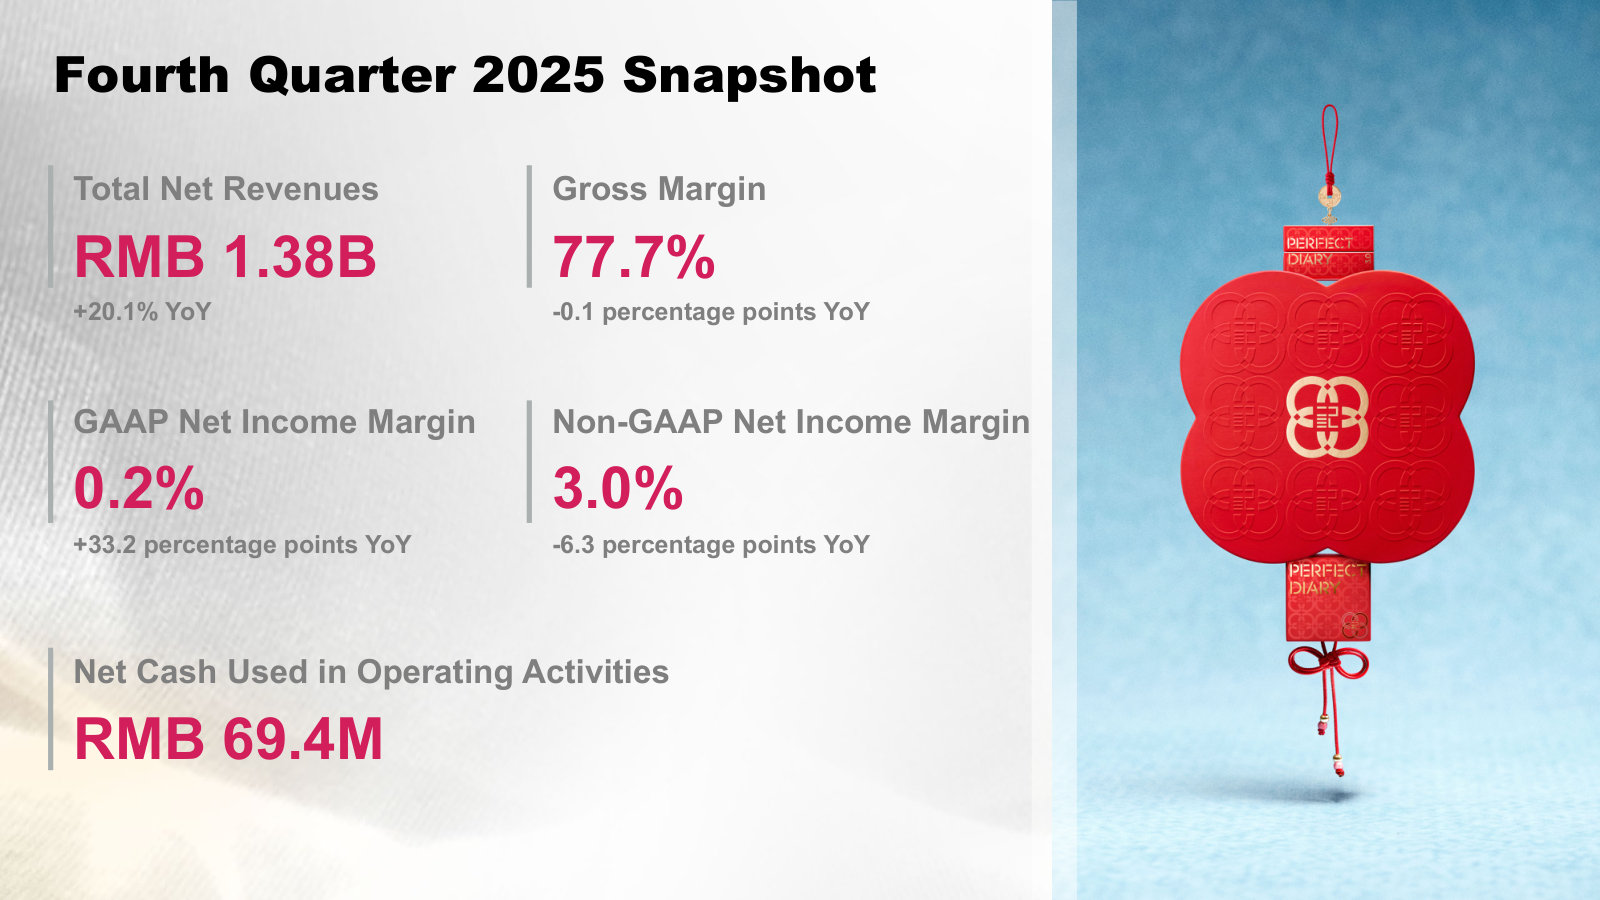
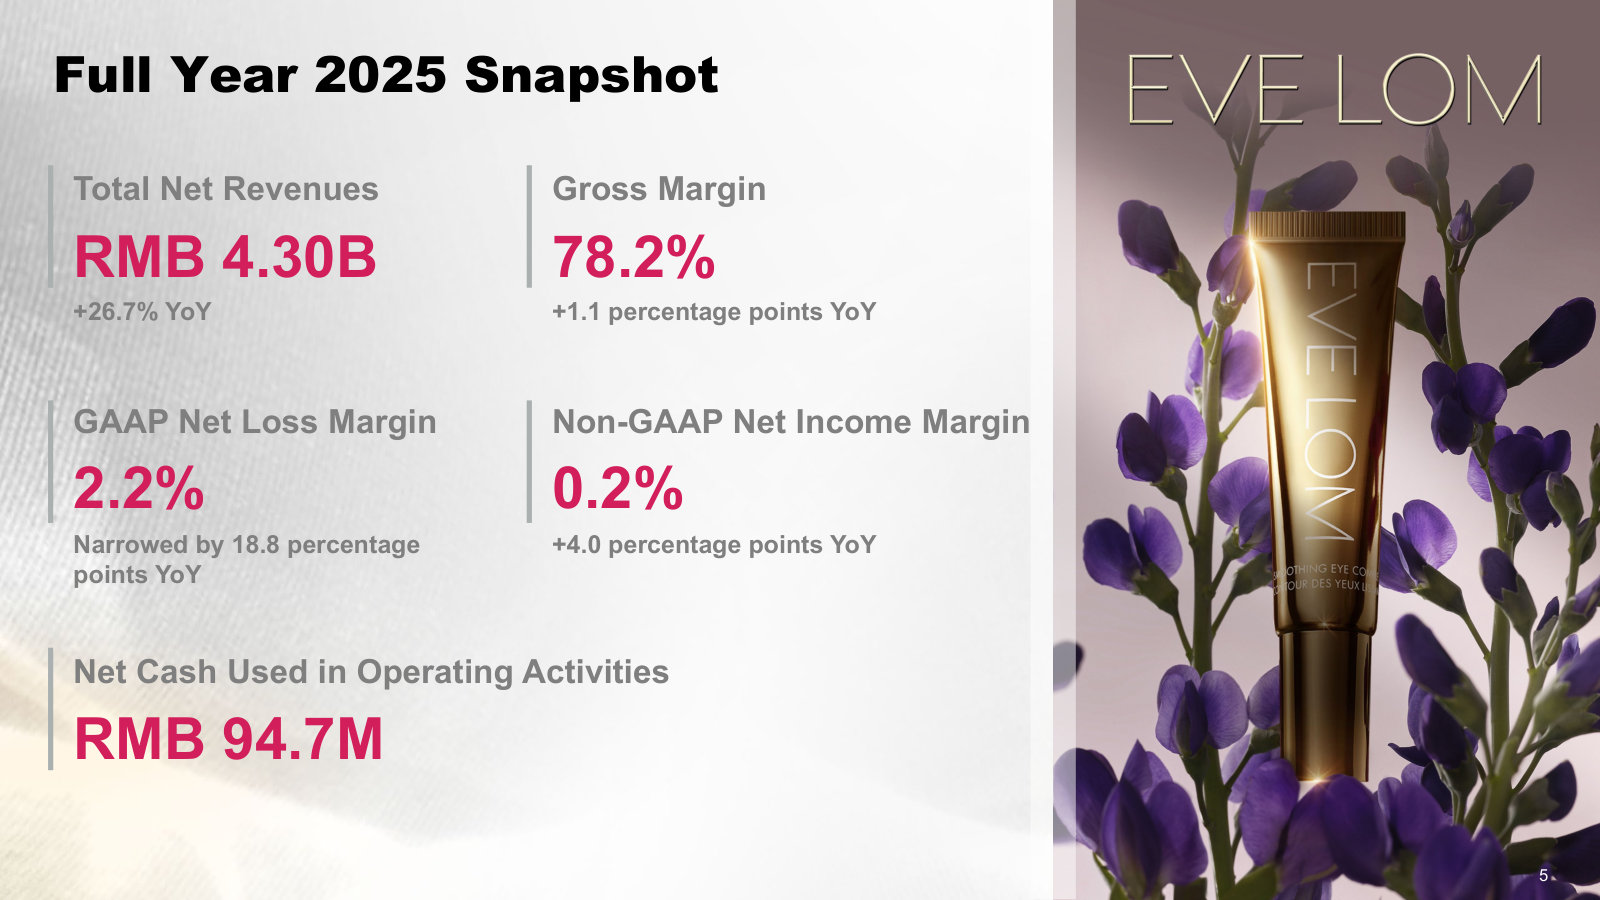
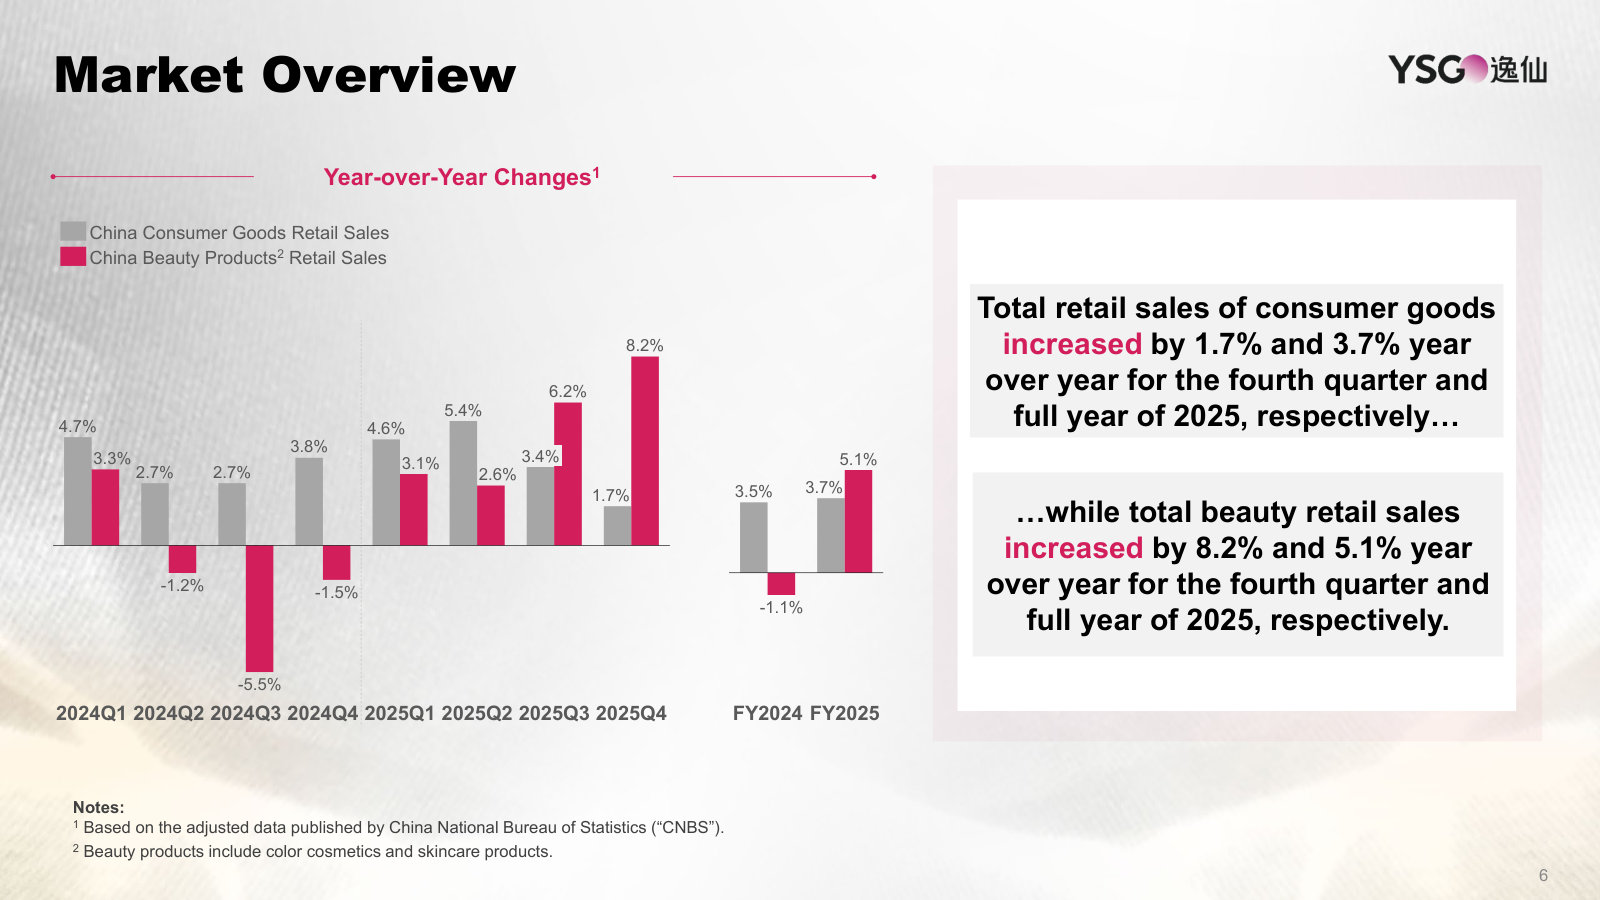
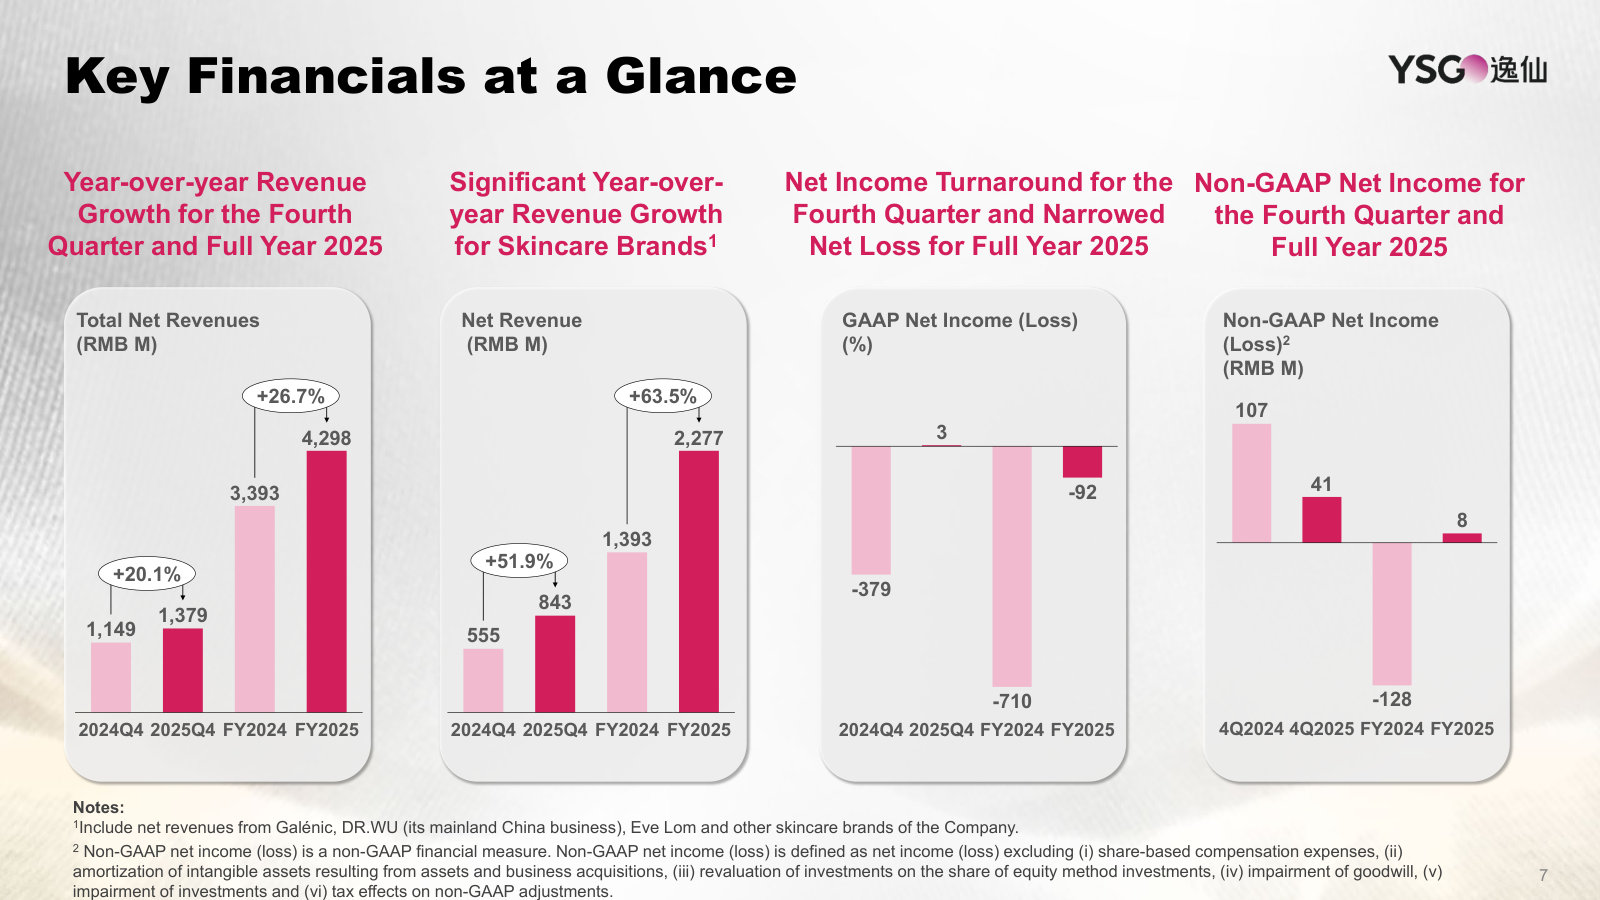
Fourth Quarter & Full Year 2025 Investor Presentation — Q4 & FY2025
The fullest current statement of the business: full-year results, the segment mix, R&D, and the whole financial picture. · Open the full document →
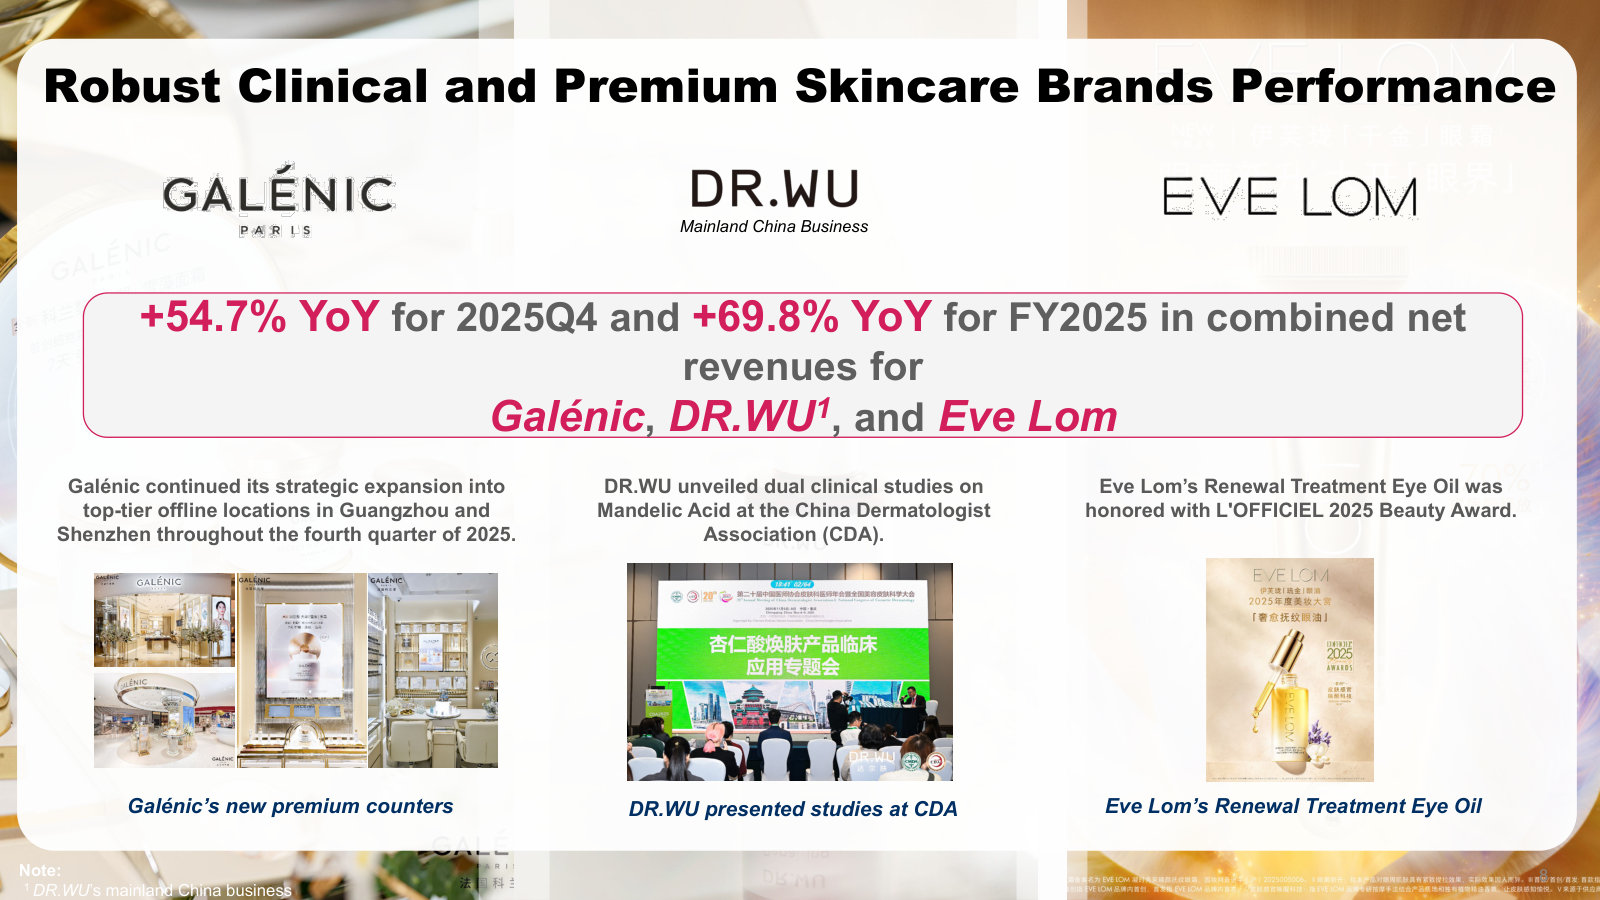
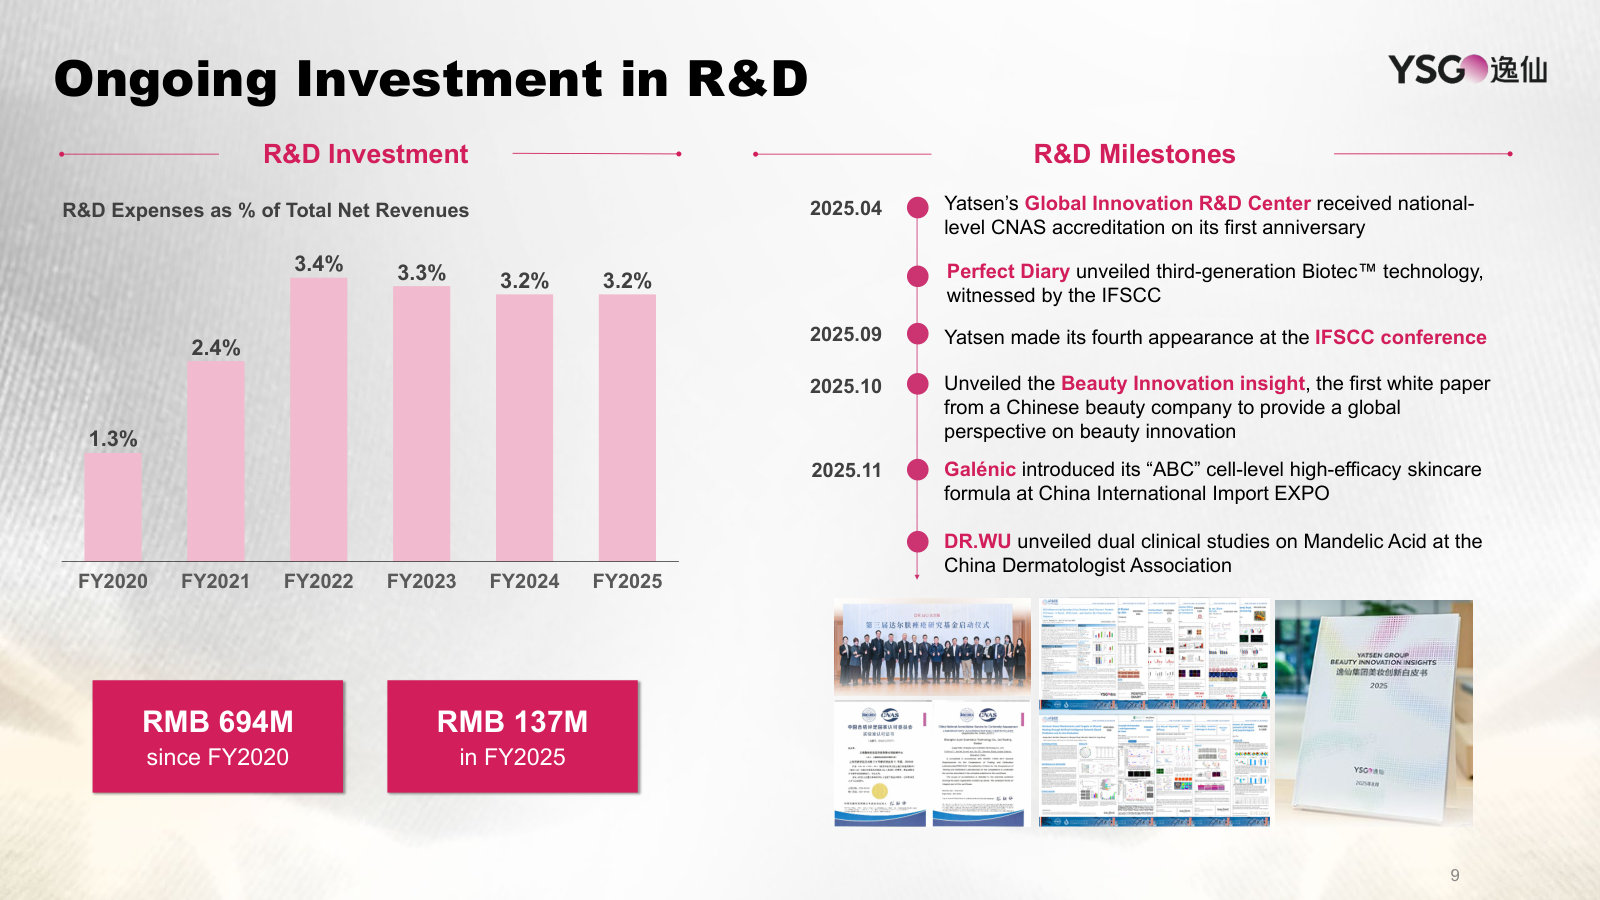
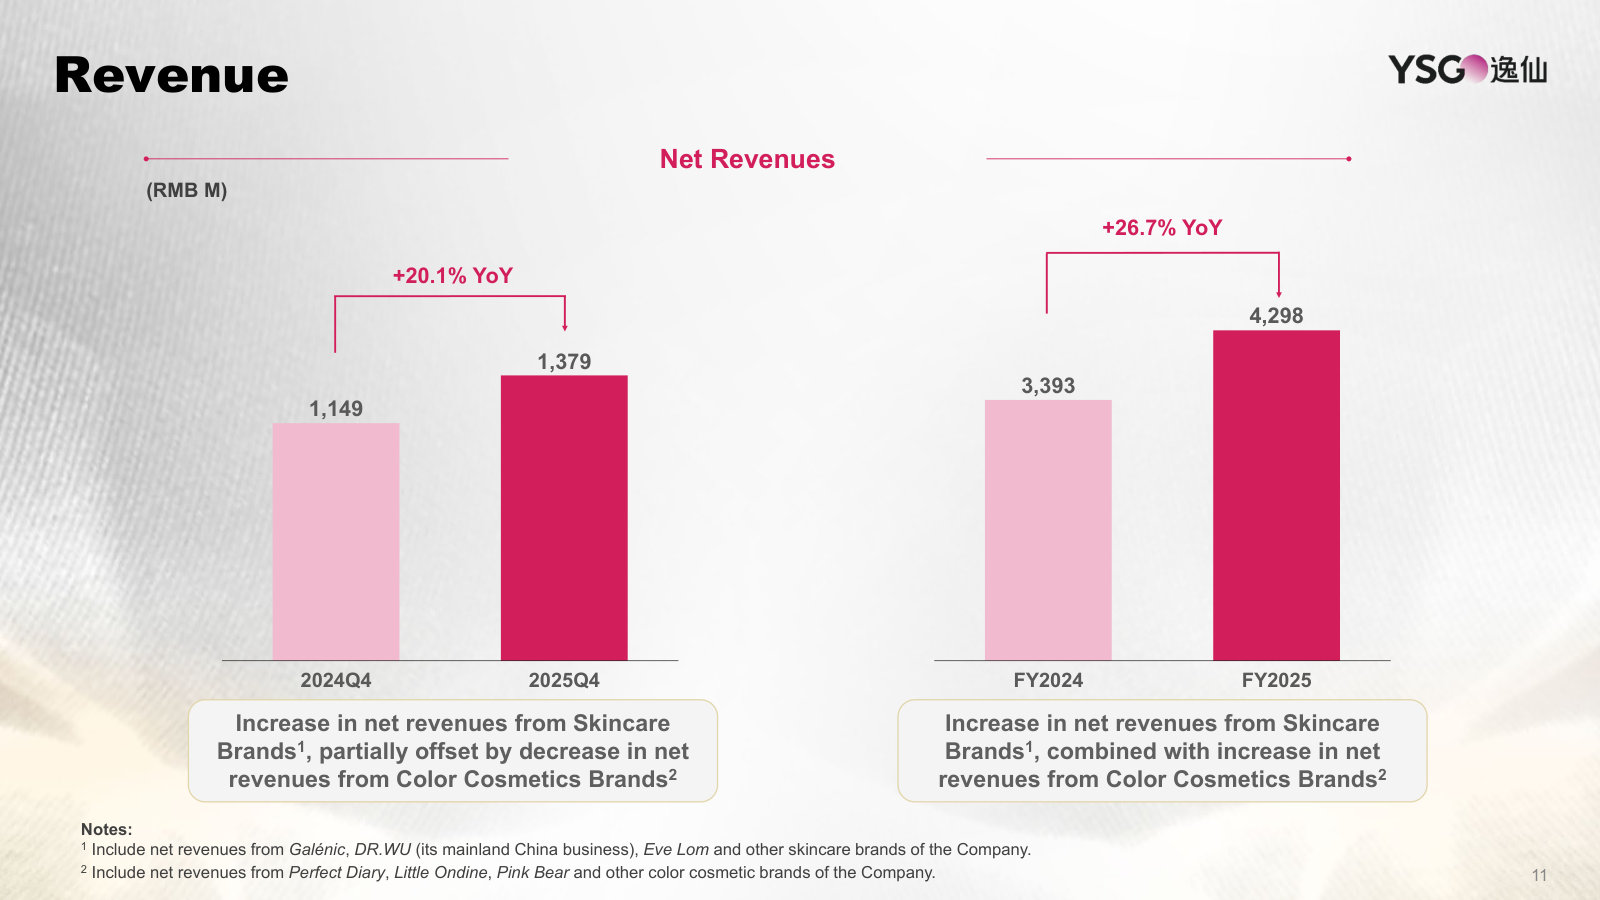
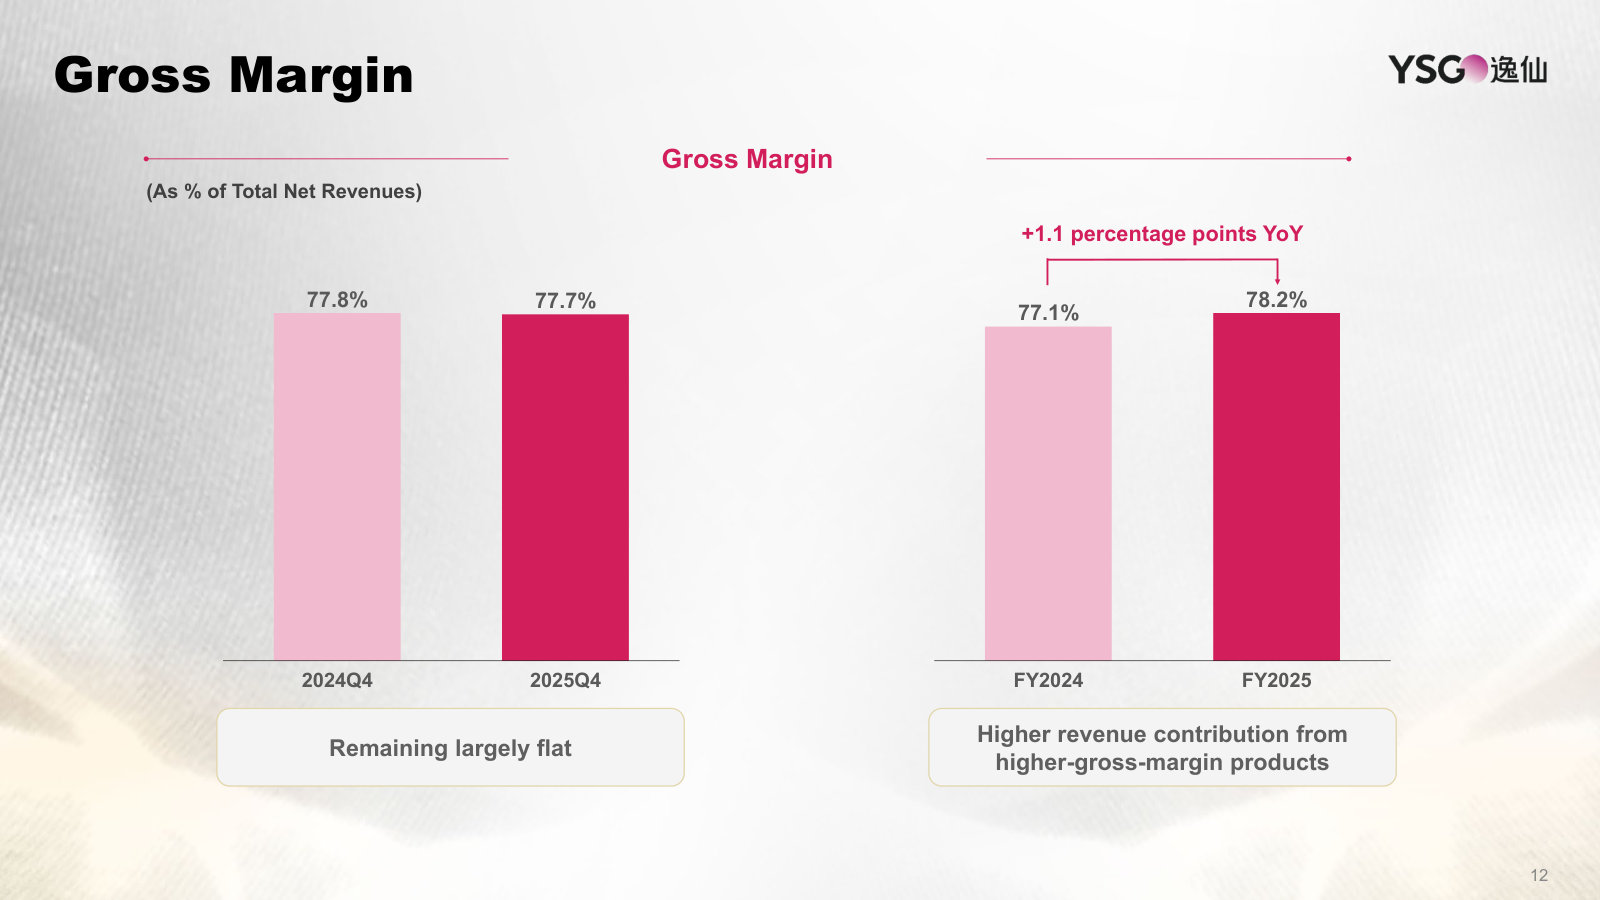
Fourth Quarter & Full Year 2023 Investor Presentation — Q4 & FY2023
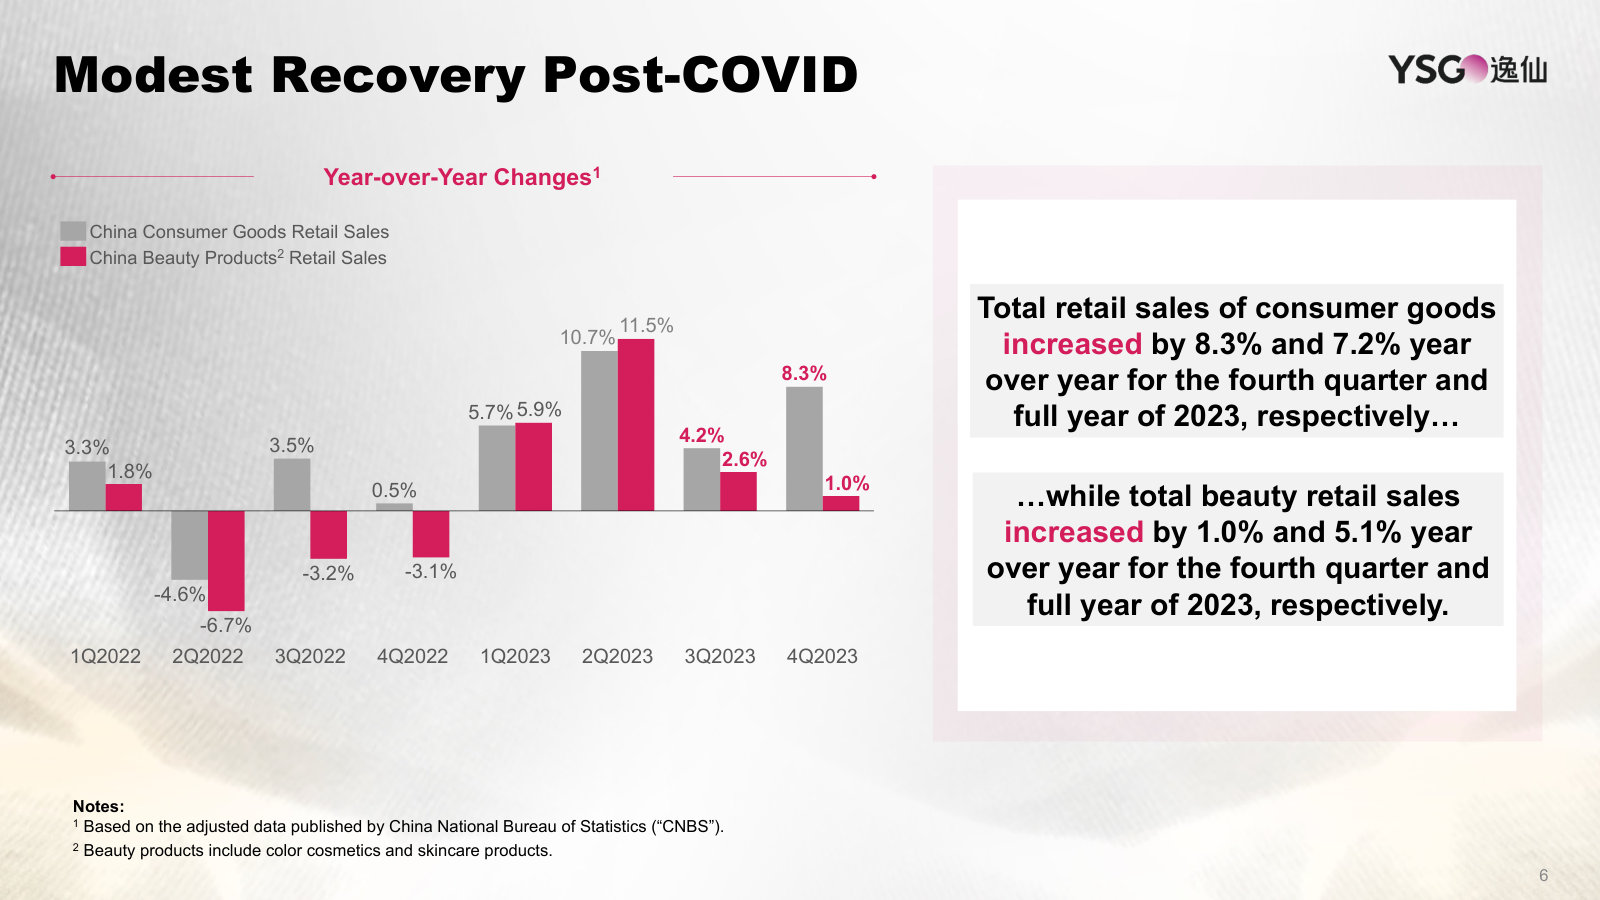
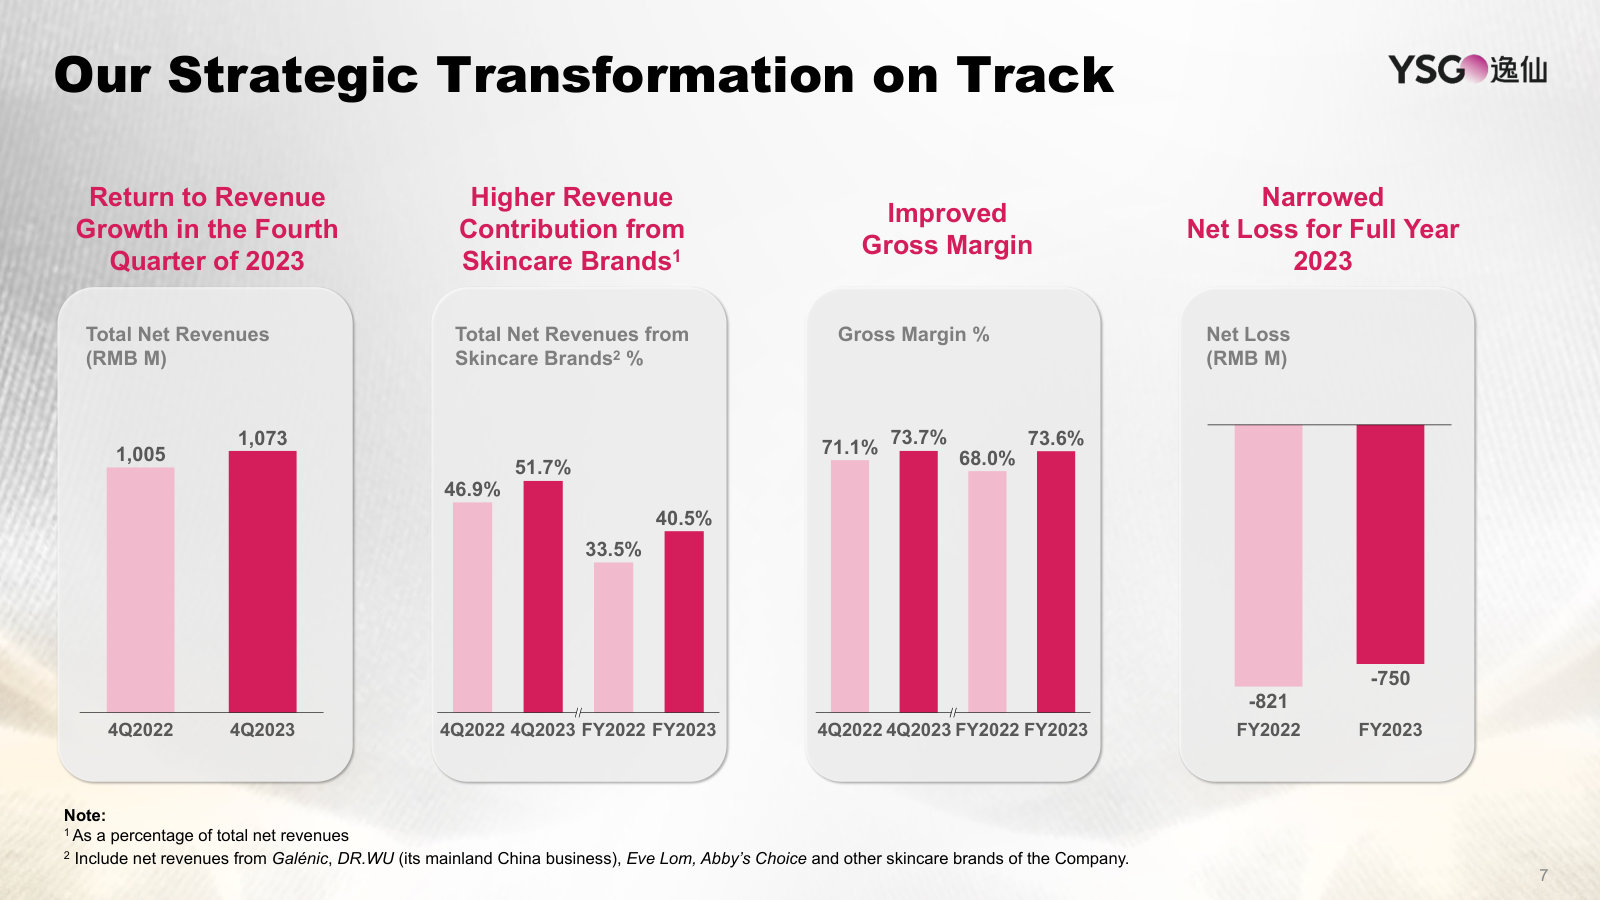
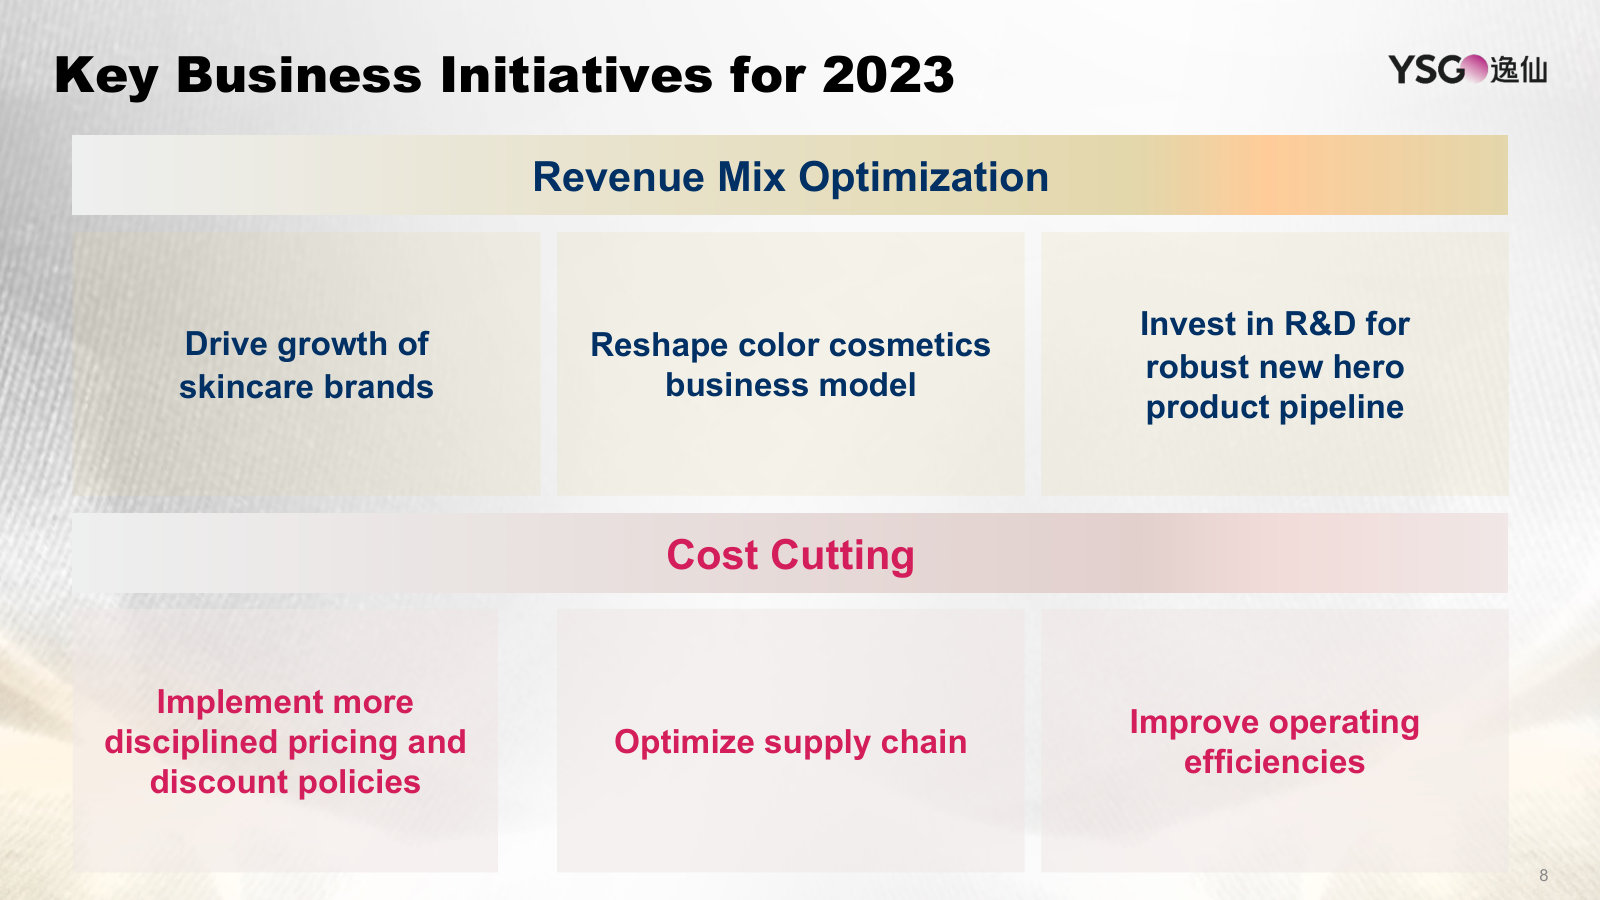
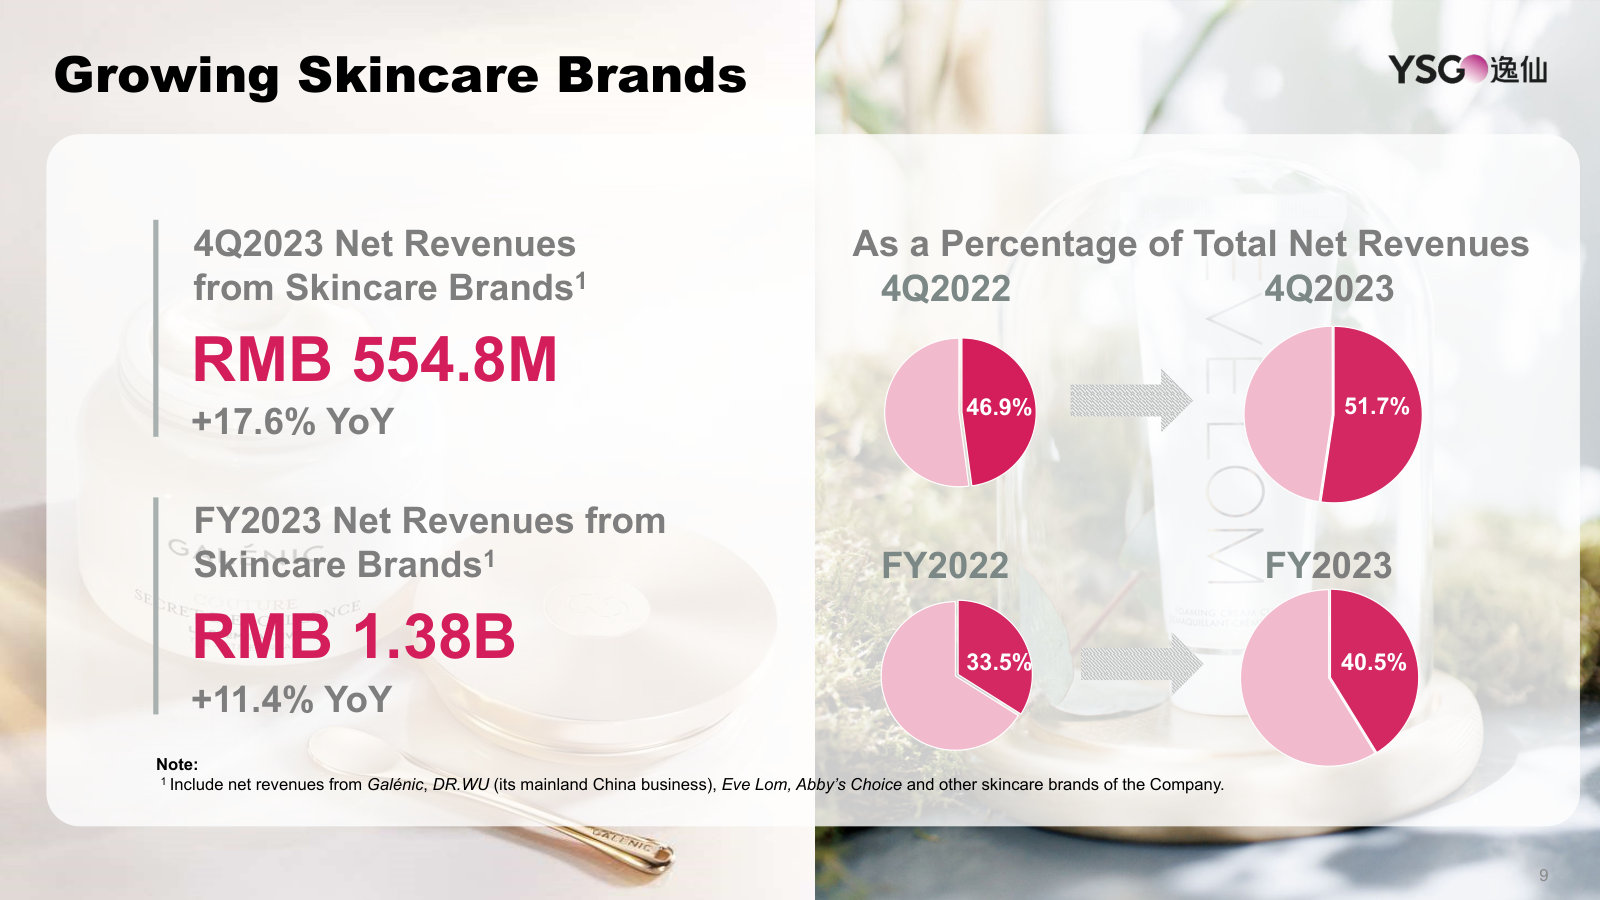
The clearest telling of the strategic transformation and product story — how a Perfect Diary color-cosmetics house became a skincare-led group. · Open the full document →

More from management
Fourth Quarter & Full Year 2024 Investor Presentation — Q4 & FY2024 · 17 pages · The FY2024 baseline — where revenue and margins stood the year before the 2025 re-acceleration. · Open →
First Quarter 2023 Investor Presentation — 1Q2023 · 16 pages · Earliest transformation deck; includes the offline experience-store footcount and the original cost-cutting plan. · Open →
Yatsen Holding Limited's management answers for the business every quarter. These are the exchanges that explain it best — verbatim, from the call transcripts preserved in Sources. Each link opens the full transcript at that page in a new tab.
Q1 2026 Earnings Call — Q1 2026
The most recent call: skincare +58.5% and a record ~80% gross margin collide with a swing to an operating loss as Douyin traffic costs spike — and a convertible-note raise lands. · Open the full transcript →
Management concedes S&M rose on higher Douyin traffic-acquisition costs, and names channel mix and fixed-cost leverage as the fix.
Jinfeng Huang (Founder, Chairman & CEO): Our third pillar is improving overall profitability. So during the first quarter, our selling and marketing expenses as a percentage of total net revenues, we experienced an increase. As a result of both the continued investment in building our core brands and the elevated industry-wide trafic acquisition costs on the Doing platform. However, our commitment to long-term profitability optimization remains unwavering. More forward, we will dynamically adjust our channel mix. streamline our operational expenses and unlock greater operational leverage for our fixed costs.
p. 7 · Read in context →
Capital allocation: the first tranche of a convertible-note and warrant private placement closed, funding the multi-brand build-out.
Jinfeng Huang (Founder, Chairman & CEO): Following our announcement on March 11, we are pleased to note that we successfully completed the first change of the private placement of convertible notes and warrants
p. 8 · Read in context →
The revenue engine, decomposed: skincare +58.5% offsetting a color-cosmetics decline, with gross margin hitting 80.2%.
Donghao Yang (CFO & Director): to clarify that all financial numbers presented today are renminbi amounts and all percentage changes refer to year-over-year changes unless otherwise noted. Total net revenues for the first quarter of 2026 increased by 22.5% to $1.02 billion from $833.5 million for the prior year period. The increase was primarily due to a 58.5% year-overyear increase in net revenues from skin care brands, partially offset by a 5% year-overyear decrease in net revenues from Cove cosmetics brands. […] Gross margin for the first quarter of 2026 increased to 80.2% from 79.1% for the prior year period.
p. 8 · Read in context →
The hardest question — foreign competition in high-end skincare — met with a hero-product-family playbook, and only half-answered.
Manqi Huang (CICC); Jinfeng Huang (Founder, Chairman & CEO): This is Manqi Huang from CICC. I have 2 questions. But my first question, we've seen a rapid growth of our skin care brands in this quarter. could management share with us how to expand our product portfolio of Skin Care brand going forward. And my second question is that how do we view the competition from foreign brands, especially in high-end skin care market? That's my 2 questions. Thank you […] We will continue to expand around proven hero product families. In quarter 1, galenic new anti-aging cream was a great success and sold out shortly after launch.
p. 10 · Read in context →
Channel mix as the profit lever: a higher professional/offline mix balances growth and margin — the model they want to replicate.
Lin Zhang (Citic Securities); Jinfeng Huang (Founder, Chairman & CEO): My question is that we have noticed Dou is growing really fast. So could you please share with us the key drivers of the growth? […] the brand has delivered strong growth while maintaining a healthier profitability profile. The 1 reason is higher B2T channel mix. including professional and off-line channels, which give us the brand a better balance between growth, shape costs and profitability. So this is a model we want to learn from and the selectively apply to other tinkers
p. 11 · Read in context →
Q4 & Full Year 2025 Earnings Call — Q4 FY2025
The turnaround made arithmetic: +26.7% full-year revenue, skincare now 53% of sales, and the first non-GAAP net profit after years of losses — with the margin playbook spelled out. · Open the full transcript →
The full-year scorecard: return to growth plus a profitability turnaround, with skincare crossing half of revenue.
Jinfeng Huang (Founder, Chairman & CEO): For the full year 2025, we also achieved a solid recovery in both revenue and profitability. Total net revenue returned to a growth trajectory increasing by 26.7% year-over-year to RMB 4.3 billion. […] For the full year, Skincare brands contributed 53% of our total net revenues. On the bottom line, we narrowed our full year net loss margin to 2.2% from 20.9% in the prior year while delivering a non-GAAP net income margin of 0.2%.
p. 2 · Read in context →
The multi-brand logic: a mass-to-premium portfolio optimizes channel mix and lifts customer lifetime value via broader regimen adoption.
Jinfeng Huang (Founder, Chairman & CEO): We believe that our expanded product portfolio could not only optimize our channel mix by providing more offerings across different platforms, but also increase customer lifetime value by encouraging broader regime adoption.
p. 3 · Read in context →
The margin-expansion playbook, itemized: higher-GM product mix, ROI-disciplined marketing, workflow cuts, and fixed-cost operating leverage.
Jinfeng Huang (Founder, Chairman & CEO): To begin with, we are optimizing our product mix by prioritizing products with higher gross margins. Channelwise, we plan to maximize marketing efficiencies through data-driven customer relationship management and a more stringent return on investment discipline while we are allocating spend toward higher return platforms. Beyond our front-end operations, we are also optimizing operational workflows to drive cost optimization. Lastly, as our top line continues to grow, we expect to gain operational leverage across our fixed expenses.
p. 4 · Read in context →
The turnaround quantified: full-year non-GAAP net income of RMB 8.4M versus a RMB 128.2M loss a year earlier.
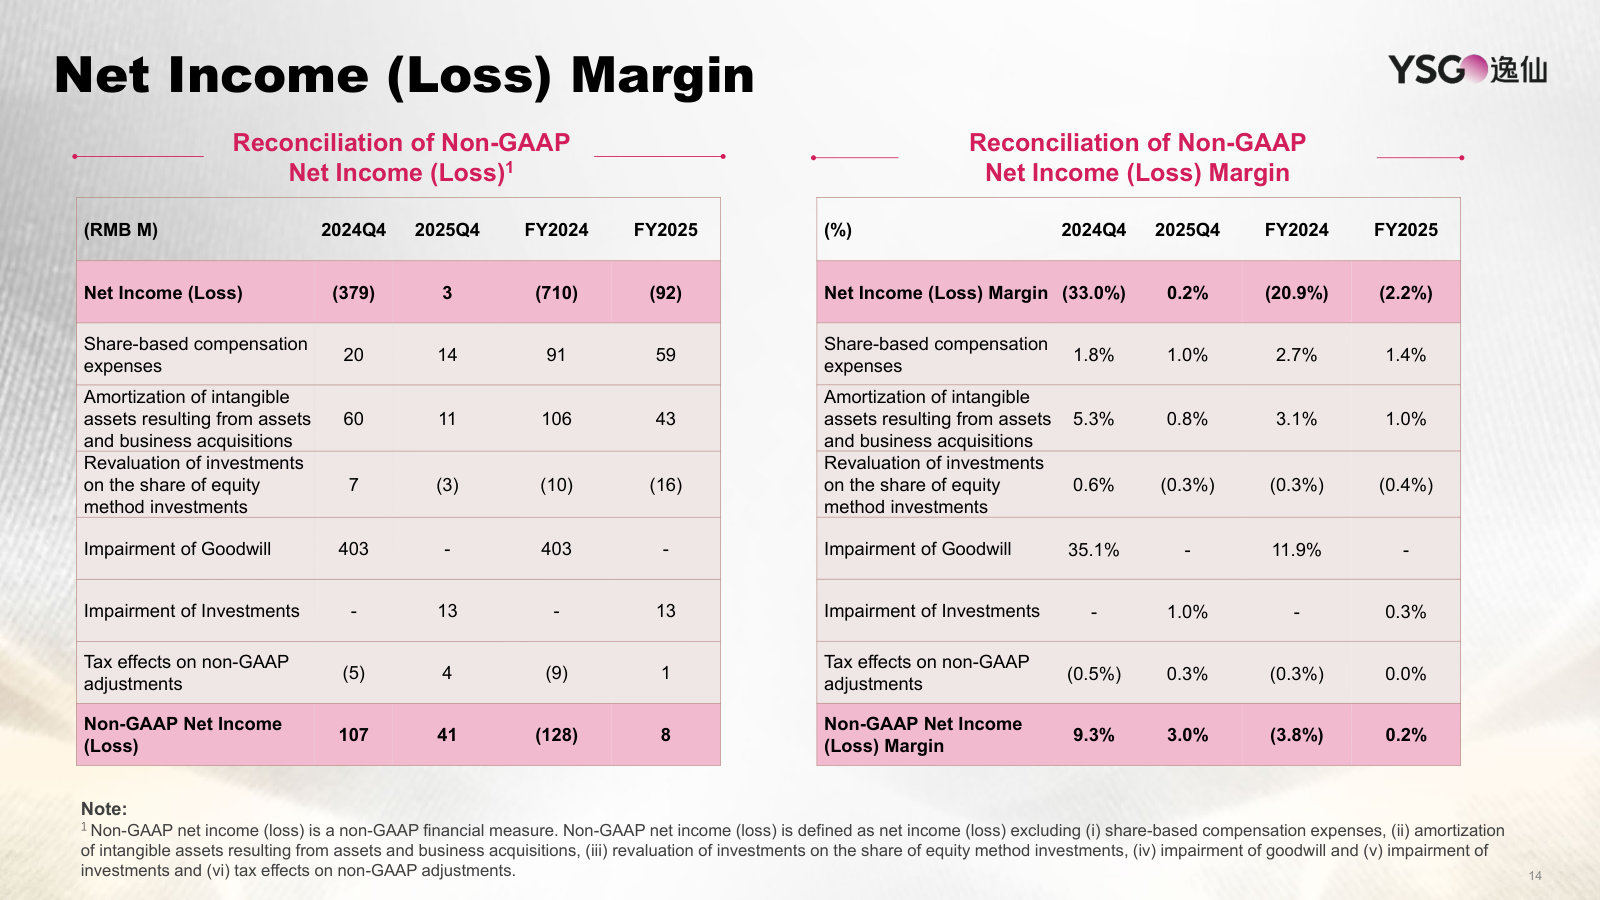
Donghao Yang (CFO & Director): Non-GAAP net income for the full year of 2025 was RMB 8.4 million as compared with non-GAAP net loss of RMB 128.2 million for the prior year period. Non-GAAP net income margin was 0.2% as compared with non-GAAP net loss margin of 3.8% for the prior year period.
p. 7 · Read in context →
The one analyst exchange presses on how net margin improves: mix shift to higher-margin skincare, operating leverage, and R&D.
Manqi Huang (CICC); Donghao Yang (CFO & Director): My first question is that how do we plan to improve our net profit margin in this year? And my second question is about our plan to expand our profit portfolio for Skincare brands in this year. […] Regarding your first question, I think this year, we’re going to continue to grow our Skincare business much faster than our Color Cosmetics business. And with Skincare business, the gross margin, net margin are typically much higher than Color Cosmetics brands. So by doing that, we’re going to be able to improve our margin profile. And secondly, our top line will continue to grow this year. And as a leveraging effect, we do believe that our net margin will improve accordingly.
p. 8 · Read in context →
Q4 & Full Year 2022 Earnings Call — Q4 FY2022
The trough call: with revenue down 34%, management splits the company in two — a growing, high-margin skincare business versus a Perfect Diary still being fixed — and sets hard long-term margin targets. · Open the full transcript →
The full picture behind a 34% revenue drop: skincare up 42% while margins expand — the mix shift that defines the reset.
Jinfeng Huang (Founder, Chairman & CEO): Total net revenues declined by 34.2% year over year in the fourth quarter to RMB 1.01 billion. So, we need to look at our revenue mix in details to see the full picture. Net revenues from our skincare brands increased by 42.4% year over year to RMB 471.6 million
p. 4 · Read in context →
Concrete cost discipline: Perfect Diary's offline store base nearly halved (286→158) while Douyin was pushed to diversify online.
Jinfeng Huang (Founder, Chairman & CEO): In terms of channel optimization, we selectively closed ofline stores and aggressively promoted our Douyin presence to diversify our online channels. As of December. 31, 2022, we operated 158 ofline experienced stores for the Perfect Diary rebrand as compared with 286 stores at the end of 2021. This strategy shift has enabled us to cut costs while still enjoying brand exposure across the country.
p. 6 · Read in context →
Hard long-term targets: skincare to exceed 50% of revenue, with clinical/premium operating margins framed in the mid-teens.
Analyst (CICC); Donghao Yang (CFO & Director): we do expect our revenue contribution from our skincare brands to exceed at least 50% or maybe even higher in the longer term. And the profitability. And for our clinical and premium skincare brand, I believe, over the long term, operating margins can be, you know, in the in the mid-teens or not higher.
p. 15 · Read in context →
Q2 2021 Earnings Call — Q2 2021
The foundational call: the founder lays out the digital-native DTC model, the acquire-in-Q3 / monetize-on-Singles'-Day loop, and the pivot toward a higher-margin skincare portfolio. · Open the full transcript →
The founding thesis stated plainly: a digital-native DTC model used to disrupt beauty, now building a portfolio of durable brands.
Jinfeng Huang (Founder, Chairman & CEO): So with our proven ability to disrupt the traditional beauty industry using a digitalized native DTC model, we are now building a portfolio of durable iconic brands supported by consumers' insights and innovation. So we believe these strategic initiatives are essential tools to position us on the path of high-quality, sustainable growth, particularly as we prepare for a busy season in the lead up to Singles' Day in the fourth quarter.
p. 4 · Read in context →
The multi-brand house taking shape: home-grown Pink Bear plus acquired skincare brands, with skincare already >20% of gross sales.
Jinfeng Huang (Founder, Chairman & CEO): The newly launched color cosmetics brand, Pink Bear, has seen fast growth since it was developed in March 2021. This sensational new brand sold over more than 500,000 lip glosses during the first June 18th campaign, garnering the award as the fastest growing new cosmetic brand on Tmall in 2021. […] We are also excited about our progress in skincare, which has grown to represent more than 20% of our gross sales in the second quarter. Our new innovative skincare products strongly resonated with our consumers. Galénic pure brightening vitamin C powder quickly sold out following its initiative – initial launch on Mainland China this April.
p. 5 · Read in context →
The unit-economics turn: sales & marketing cut to 51% of revenue from 71% a quarter earlier, while R&D nearly doubled to 2.3%.
Jinfeng Huang (Founder, Chairman & CEO): The end result was a decline in our sales and marketing expenses to 51% of total net revenues based on non-GAAP measures, compared to 71% last quarter and 62.7% in the fourth quarter of 2020. We have also set up our investment in R&D, which increased to 2.3% of total net revenues this quarter from 1.4% a year ago.
p. 6 · Read in context →
Growth vs. margin, candidly: growth stays first, tilted to skincare, with an admission they 'moved too fast' off Perfect Diary.
Louise Li (Bank of America Merrill Lynch); Jinfeng Huang (Founder, Chairman & CEO): I think so right now, we are taking a more sustainable growth strategy. So the key focus is still on growth. But if we look at the – what does it mean for Yatsen is that we think that the value of the growth coming from the skincare brands and coming from our premium skincare brands is more valuable for the whole group. So that's why we will continue to devote more resources to grow the skincare brands. And then also for our flagship brand, Perfect Diary, as I mentioned before, previously, we did move too fast to reallocate our talent into the skincare BU. And now we think because of the intensifying competition, we need to refocus and also to devote more resources to continue the growth trend of our main brands. So growth will be the key prioritized – key priority of the company. But the reason we see the optimized bottom line is because we have a very high discipline in the ROI – in the resource allocation to maintain a higher ROI level.
p. 16 · Read in context →
More calls
Q4 & Full Year 2024 Earnings Call — Q4 FY2024 · 16 pages · Where the recovery first showed arithmetic: skincare a record 41.1% of revenue, Q4 non-GAAP net margin swinging to +9.3%, alongside a RMB 403M Eve Lom goodwill impairment. · Open →
Q4 & Full Year 2023 Earnings Call — Q4 FY2023 · 16 pages · The margin-turnaround year quantified: full-year gross margin up to 73.6%, non-GAAP net loss margin nearly halved, and Perfect Diary's Biolip relaunch ramping new-product mix past 50%. · Open →
Q1 2025 Earnings Call — Q1 2025 · 14 pages · The first quarter of 2025 — read for the early-year read on skincare momentum and how management framed the balance of growth and profitability heading into the year. · Open →
Q3 2021 Earnings Call — Q3 2021 · 28 pages · The Singles'-Day-quarter call closest to IPO — go here for how the early DTC acquire-and-monetize model performed under peak-season pressure. · Open →
Q4 & Full Year 2021 Earnings Call — Q4 FY2021 · 26 pages · The first full-year call as the color-cosmetics downturn set in — the baseline against which the entire skincare pivot and cost reset is measured. · Open →
Yatsen Holding Limited's annual reports contain management's most considered account of the business. These are the sections, passages and visual pages worth opening in the originals preserved in Sources.
Yatsen Holding Limited — FY2025 Annual Report (Form 20-F) — FY2025
The latest full account of a China beauty group mid-pivot: skincare now a revenue majority, losses nearly erased, all through a VIE. · Open the full document →
Item 3. Key Information — D. Risk Factors — p. 18 · Read the full section →
The two risks that most define the equity: a still-unproven path to profit and a business owned only by contract, not equity.
Five straight years of net losses and negative operating cash flow, though both are narrowing.
We incurred a net loss of RMB750.2 million in 2023, RMB710.2 million in 2024, and RMB92.4 million (US$13.2 million) in 2025. We had negative cash flows from operating activities of RMB107.4 million, RMB243.7 million and RMB94.7 million (US$13.5 million) for the fiscal years ended December 31, 2023, 2024 and 2025, respectively. We cannot assure you that we will be able to generate net profits or positive cash flow from operating activities in the future.
p. 23 · Read in context →
Foreign ownership is restricted, so control of the China operations rests on contracts with the VIE, not shares.
We have to rely on the contractual arrangements with the VIE and its shareholders to operate or invest in companies that operate the business in areas where foreign ownership is restricted. These contractual arrangements, however, may not be as effective as direct ownership in providing us with control over the VIE.
p. 53 · Read in context →
Item 4. Information on the Company — B. Business Overview — p. 78 · Read the full section →
How the business now makes money after the 2022 reset — a deliberate tilt from color cosmetics toward higher-margin skincare.
Skincare lifted from a third to over half of revenue; gross margin up to 78.2% and net loss margin down to 2.2%.
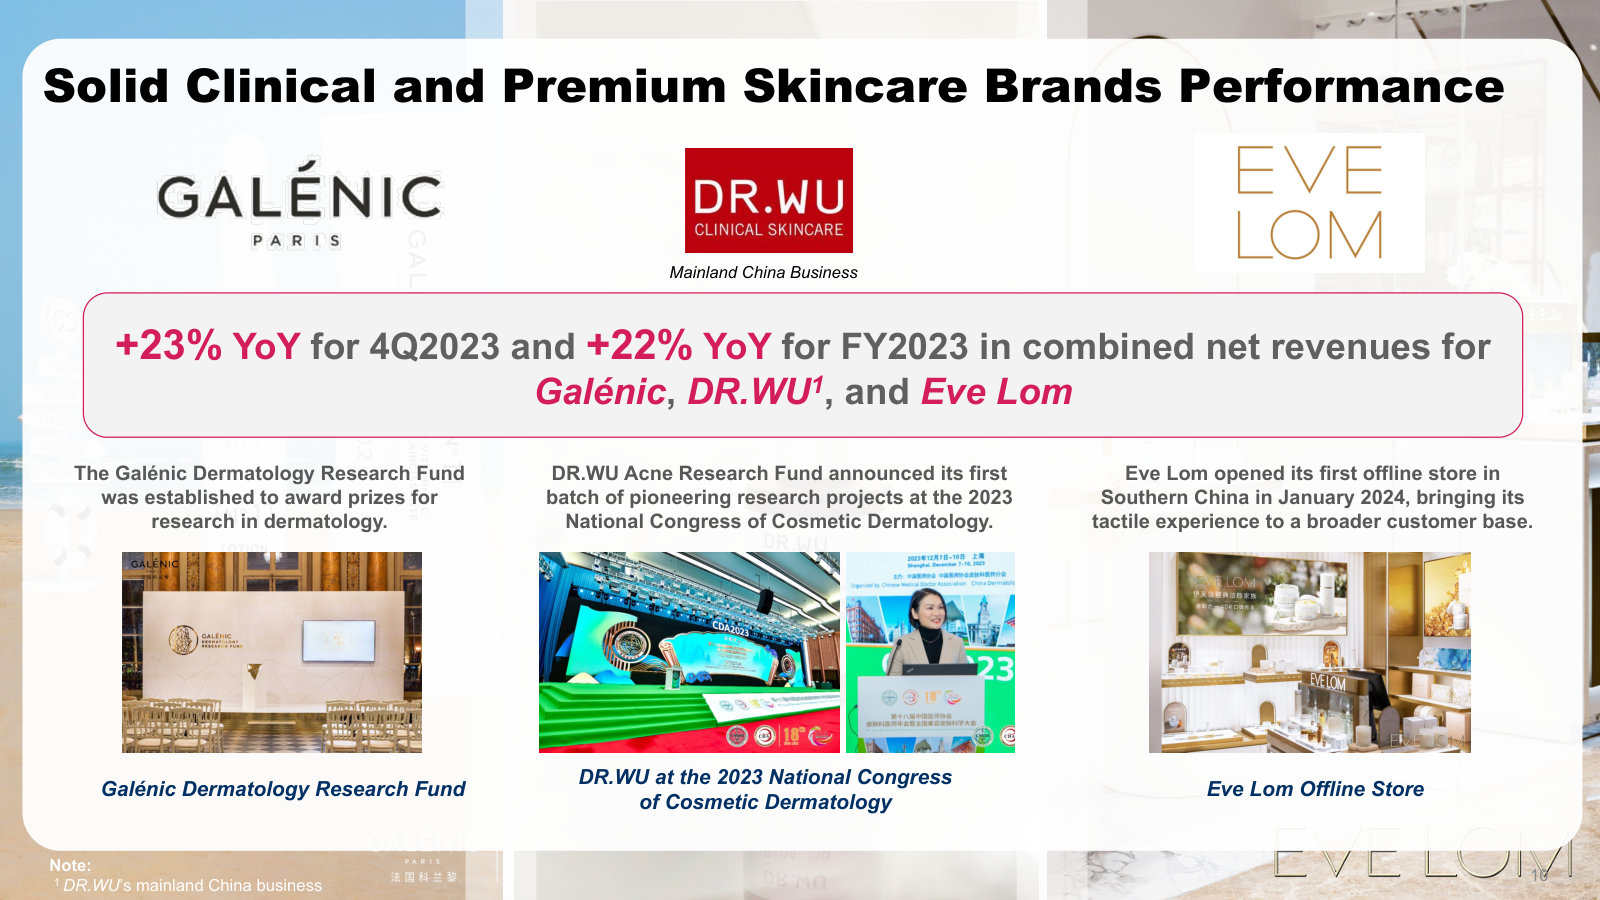
Strengthening brand equity across our multi-brand portfolio. A key pillar of this plan is the rapid expansion of our skincare brands, including Galénic, DR.WU (its mainland China business), and Eve Lom. […] Revenue contribution from our skincare brands expanded significantly from 33.5% in 2022 to 53.0% in 2025, driven by a three-year compound annual growth rate of 22.4% for the skincare brands. […] Improving our overall financial performance. We have achieved consistent margin expansion through stricter pricing and discount policies, optimized supply chains and enhanced operating efficiency. Our gross margin increased from 68.0% in 2022 to 78.2% in 2025. Concurrently, we significantly narrowed our net loss margin from 22.2% in 2022 to 2.2% in 2025.
p. 79 · Read in context →
Item 4. Information on the Company — C. Organizational Structure — p. 116 · Read the full section →
The corporate map a foreign investor actually buys into — a Cayman shell that consolidates the China operating company by contract.
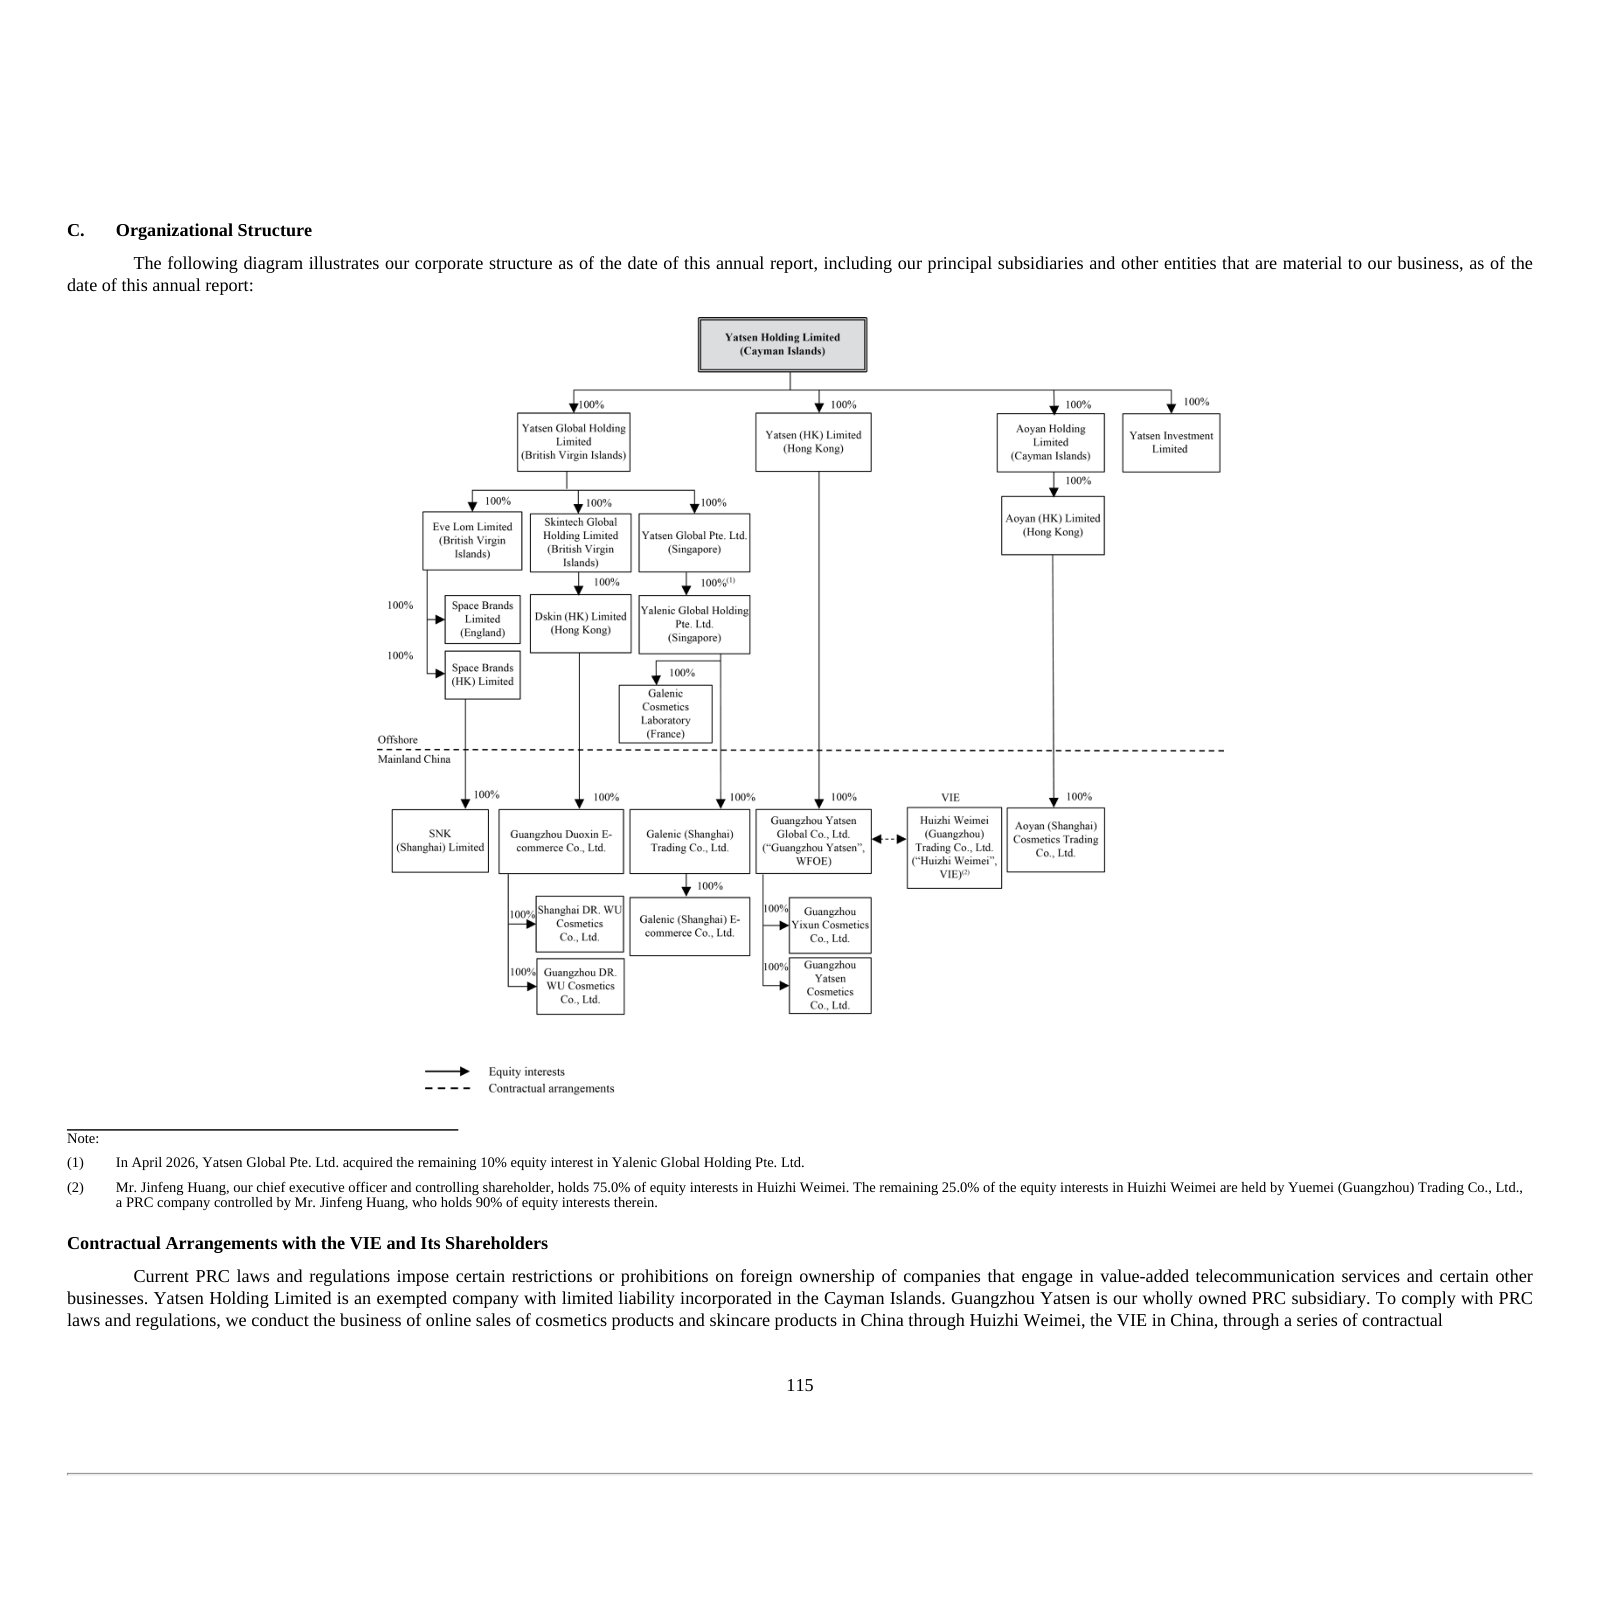
Online cosmetics sales run through the VIE, Huizhi Weimei, to satisfy PRC foreign-ownership limits.
Current PRC laws and regulations impose certain restrictions or prohibitions on foreign ownership of companies that engage in value-added telecommunication services and certain other businesses. […] To comply with PRC laws and regulations, we conduct the business of online sales of cosmetics products and skincare products in China through Huizhi Weimei, the VIE in China
p. 116 · Read in context →
Item 5. Operating and Financial Review and Prospects — A. Operating Results — p. 120 · Read the full section →
Management's own walk through what drove results — the skincare surge, margin gains, and the goodwill charges that vanished in 2025.
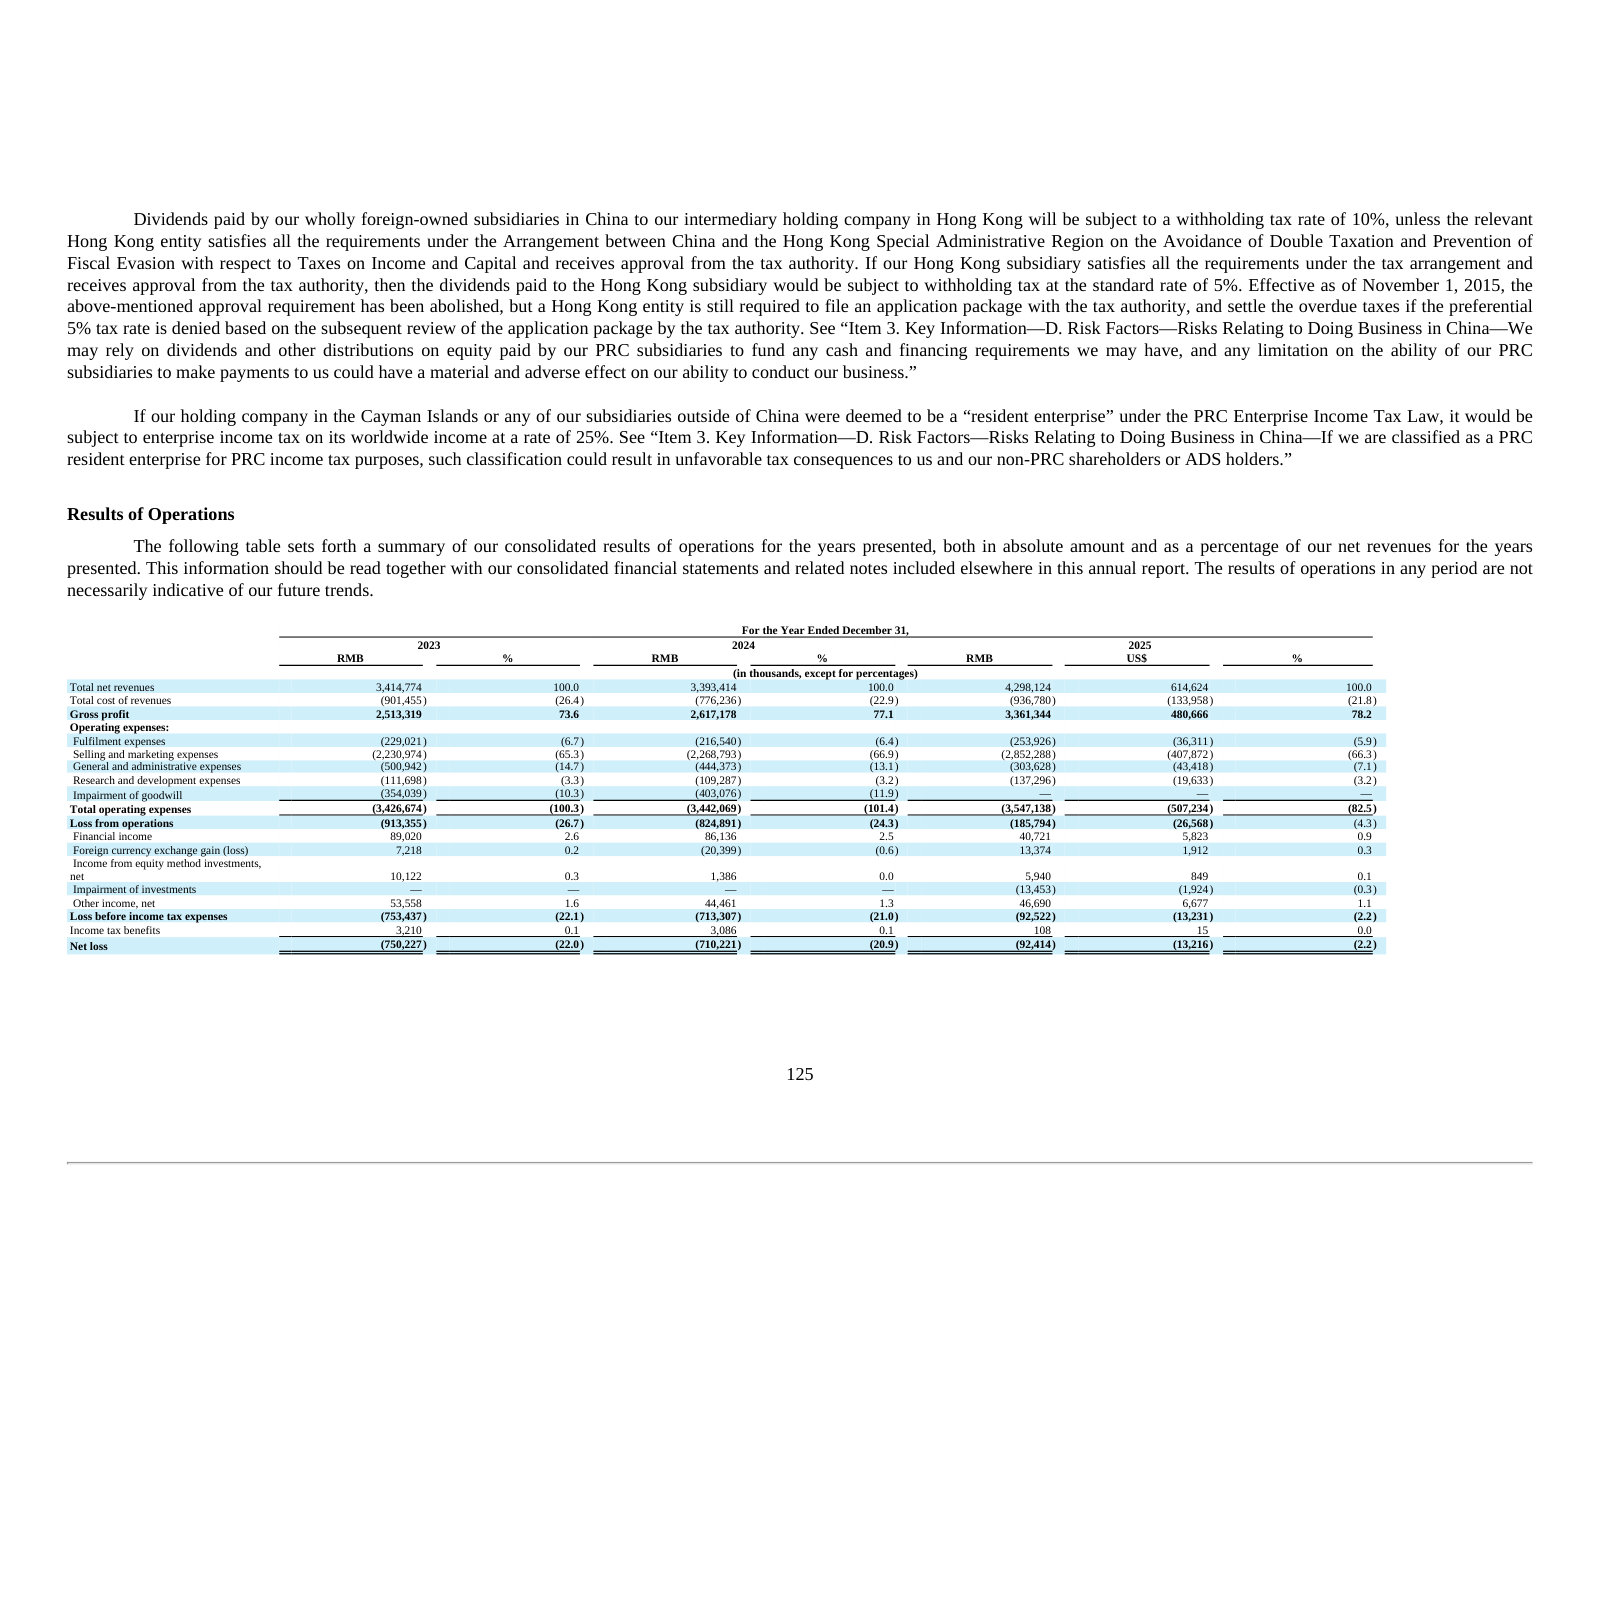
2025 revenue rose 26.7%, driven by a 63.5% jump in skincare; color cosmetics grew just 1.9%.
Our net revenues increased by 26.7% from RMB3.39 billion in 2024 to RMB4.30 billion (US$614.6 million) in 2025, primarily attributable to a 63.5% year-over-year increase in net revenues from Skincare Brands, as well as a 1.9% year-over-year increase in net revenues from Color Cosmetics Brands. Our net revenues generated through Skincare Brands as a percentage of total net revenues increased from 41.1% in 2024 to 53.0% in 2025.
p. 128 · Read in context →
Item 5. Operating and Financial Review and Prospects — B. Liquidity and Capital Resources — p. 132 · Read the full section →
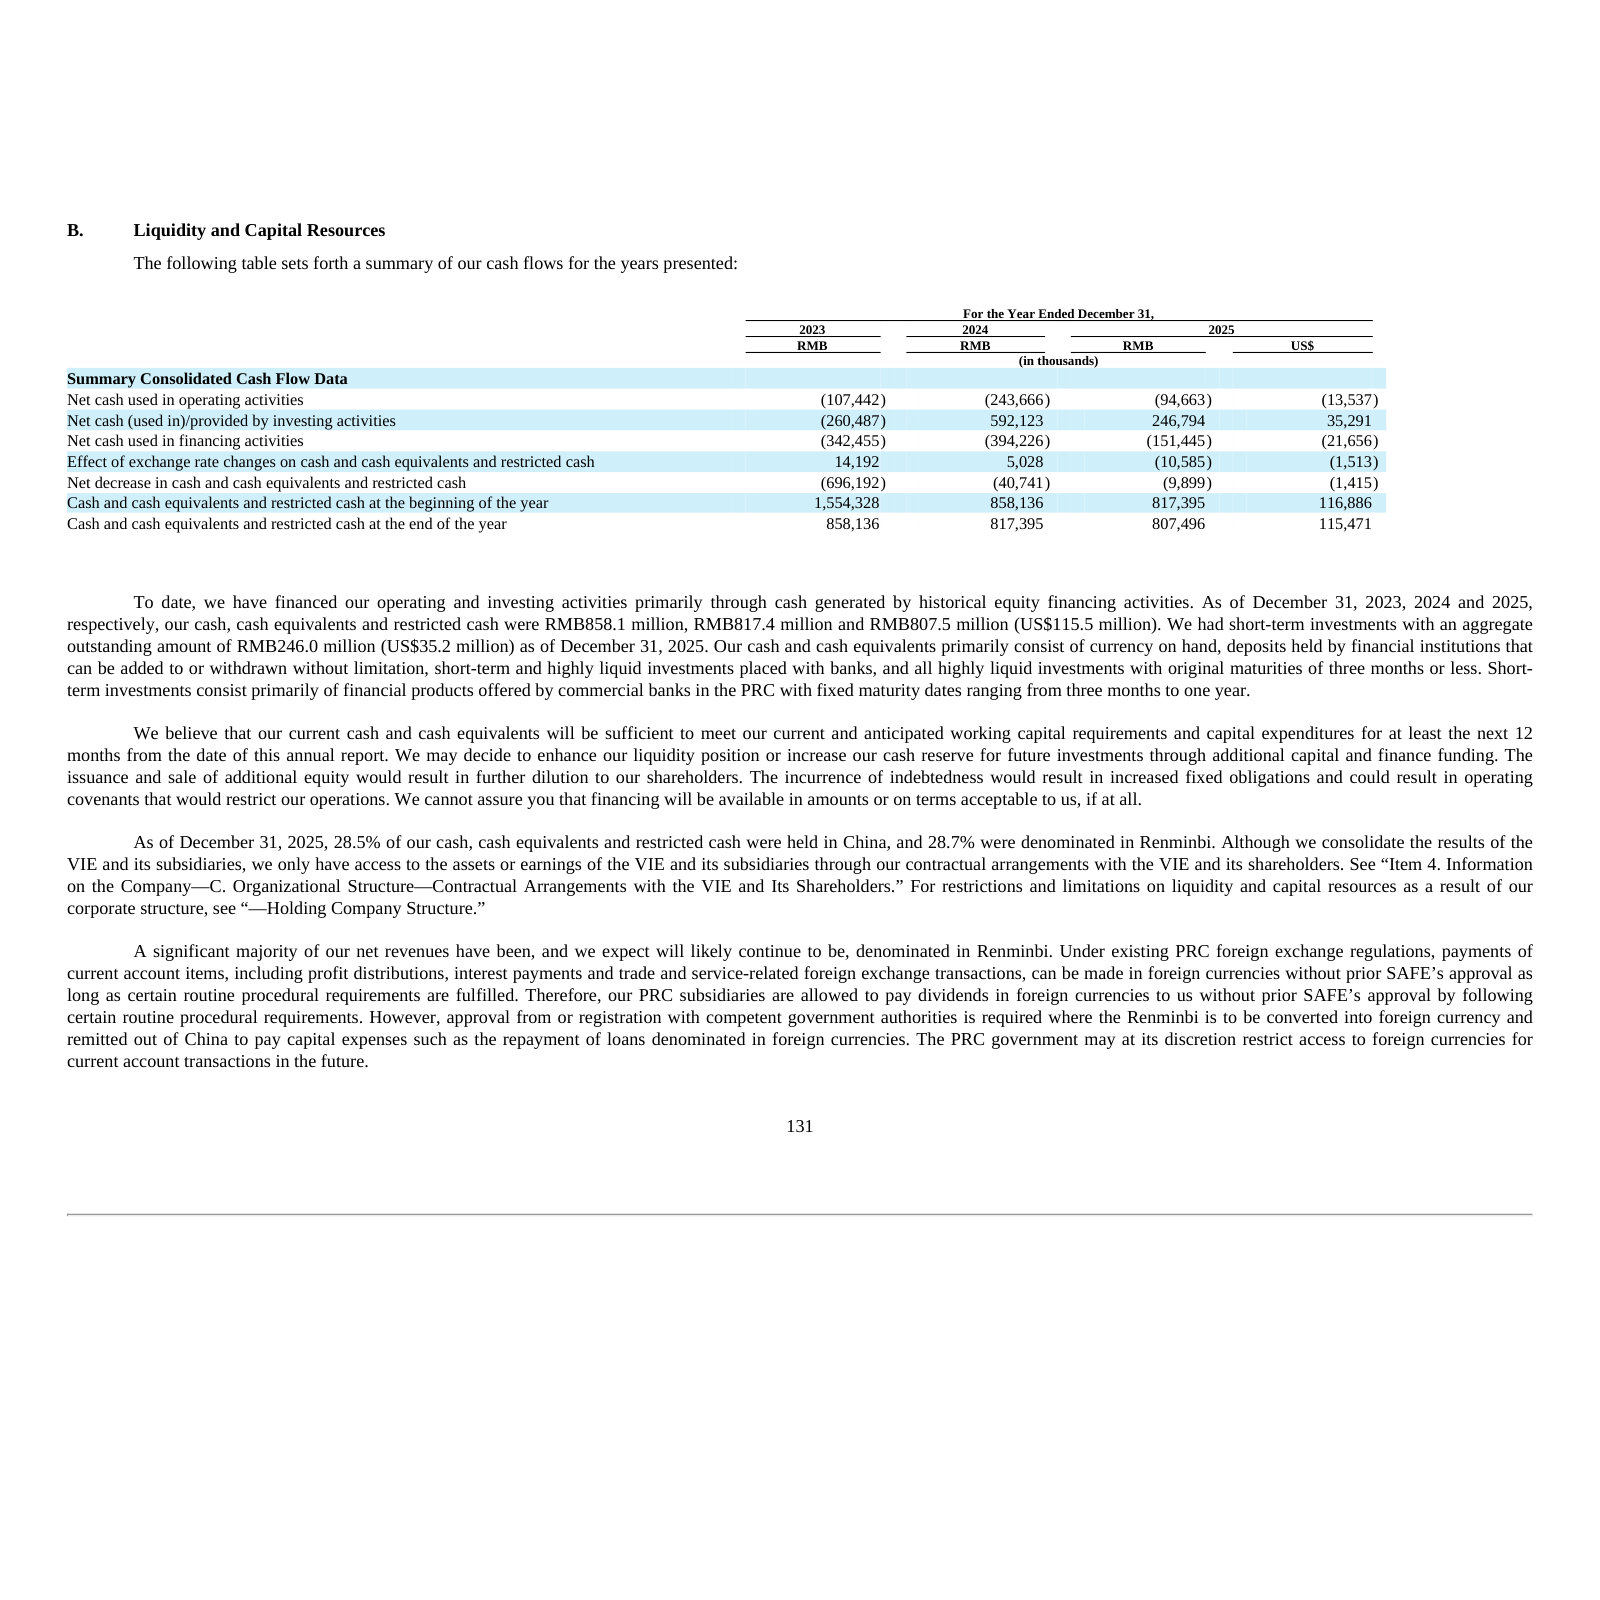
Cash is the live question for a company still burning it — this is the three-year cash-flow picture in one table.
Yatsen Holding Limited — FY2021 Annual Report (Form 20-F) — FY2021
The pre-pivot business in its own words: a Perfect Diary-led color-cosmetics DTC group, before skincare became the revenue majority. · Open the full document →
Item 4. Information on the Company — B. Business Overview — p. 69 · Read the full section →
Reads as a different company — flagship Perfect Diary and a DTC model, versus today's R&D-led skincare framing.
More annual reports
Yatsen Holding Limited — FY2024 Annual Report (Form 20-F) — FY2024 · 254 pages · Mid-transition year: skincare at 41% of revenue and a RMB403m goodwill impairment on the skincare segment. · Open →
Yatsen Holding Limited — FY2023 Annual Report (Form 20-F) — FY2023 · 264 pages · Perfect Diary repositioned around 'makeup skintification'; first RMB354m skincare goodwill write-down. · Open →
Yatsen Holding Limited — FY2022 Annual Report (Form 20-F) — FY2022 · 248 pages · First report to lay out the strategic transformation plan, with net loss margin still at 22.2%. · Open →
Competitors describe Yatsen Holding Limited's market in their own filings and calls. These verified passages and visual pages show where their strategies meet, using source documents preserved in Sources.
Proya Cosmetics (603605.SH)
China's largest listed domestic beauty group by revenue and Yatsen's closest multi-brand peer — skincare flagship Proya (珀莱雅) plus the Timage (彩棠) color-cosmetics brand, sold through the same Tmall and Douyin channels Yatsen relies on.
Proya's stated Double-11 platform rankings (as of 30 October): its main Proya brand and its Timage (彩棠) color-cosmetics brand across Tmall, Douyin and JD.
截至 10月 30日,主品牌珀莱雅的排名稳居天猫美妆榜首、抖音美妆第一、京东国货护肤第一;彩棠排名天猫彩妆第六、国货第二,抖音彩妆第三、国货第二,京东国货第一;OR 排名天猫洗护第五、抖音洗护第六,OR 增速实现翻倍增长
p. 2 · Read in context →
Proya management's stated view that its China market share still trails the No.1 industry peer by a wide margin, with the main Proya brand to be grown via mature and new product lines.
目前公司在中国市场的市占率,对比中国化妆品市场排名第一的同行美妆公司的市占率,还有很大的提升空间,还有很多的机会;就主品牌珀莱雅来说,在现有成熟系列如红宝石、双抗的基础上,公司会重点发展源力、能量、美白、底妆等系列
p. 4 · Read in context →
Proya on its Timage (彩棠) professional color-cosmetics brand: first-half 2025 revenue of ¥705m (+21.1%) and a reinforced push into base makeup.
2025年上半年,彩棠品牌表现亮眼,实现营收 7.05亿元,同比增长21.11%。2025年下半年,彩棠品牌持续深化专业化妆师彩妆品牌专业心智,品牌上,持续深耕“中国妆,原生美”的品牌理念,巩固品牌差异化品牌调性;产品上,在巩固面部彩妆大单品和品类的同时,强化底妆产品线
p. 5 · Read in context →
Shanghai Chicmax (Chicmax Group) (2145.HK)
A multi-brand, online- and livestream-led Chinese beauty group whose model mirrors Yatsen's — flagship KANS (韩束) skincare on Douyin plus makeup, dermocosmetics and mother-baby brands.
Chicmax describes its multi-brand strategy spanning six segments, including mass skincare, makeup and dermocosmetics.
Chicmax is a leader of multi-brand cosmetics industry driven by scientific research, we establish a presence in six major segments, i.e. mass skin care, maternity and childcare & teenagers skin care, washing and personal care, makeup, dermocosmetics and premium skin care, building two multinational research centers and two multinational supply chain bases worldwide. We focus on the implementation of multi-brand strategy and have remained dedicated to it since our establishment.
p. 6 · Read in context →
Chicmax's claim, citing industry media, that flagship brand KANS ranked first in 2025 online-channel GMV among domestic cosmetics brands.
According to industry media reports, in 2025, the GMV of KANS on the online channel ranked first among domestic cosmetics brands.
p. 7 · Read in context →
Chicmax reports KANS 2025 revenue of RMB7.36bn (+31.6%), representing 80.2% of group revenue.
The revenue generated from KANS in 2025 was RMB7,359.6 million, representing an increase of 31.6% as compared to 2024 and accounting for 80.2% of our total revenue for the year.
p. 9 · Read in context →
Marubi Biotechnology (603983.SH)
The nearest listed play on color cosmetics: its PL/恋火 base-makeup brand competes head-on with Perfect Diary, alongside the 丸美 skincare line, both sold predominantly online.
Marubi cites China's 2025 cosmetics retail sales of ¥465.3bn (+5.1%) as the industry backdrop.
根据国家统计局统计,2025 年社会消费品零售总额 501,202 亿元,同比增长 3.7%,其中化妆品类总额 4,653 亿元,同比增长 5.1%(限额以上单位消费品零售额)
p. 9 · Read in context →
Marubi's 2025 revenue by brand: group ¥3.46bn, 丸美 skincare ¥2.55bn, and PL/恋火 color cosmetics ¥906m (roughly flat year on year).
报告期内,公司实现营业收入34.59亿元,同比上升16.48%,其中丸美品牌实现营业收入25.47亿元,同比上升 23.94%,PL 恋火品牌实现营业收入 9.06 亿元,同比基本持平
p. 9 · Read in context →
Marubi on its PL/恋火 color-cosmetics brand: six foundation SKUs in its two core series each surpassing ¥100m in annual GMV.
“看不见”和“蹭不掉”两大系列中 6 款粉底类单品均实现过亿元的年度 GMV 销售额,体现了 PL 在底妆品类上的强大产品力
p. 10 · Read in context →
L'Oréal (OR.PA)
The world's largest beauty company and the dominant force in China across mass and prestige; its market-sizing, e-commerce and China-specific commentary frame the arena Yatsen competes in.
L'Oréal sizes the global beauty market at roughly €300 billion in 2025 and characterises it as resilient.
Worth some €300 billion […] the beauty market has proved resilient, adaptable and prosperous, despite the geopolitical and economic upheaval, establishing itself as a refuge for consumers.
p. 24 · Read in context →
L'Oréal's account of a gradual 2025 mainland-China recovery, claiming L'Oréal Paris as the number-one beauty brand in the Chinese market.
The improvement was driven by mainland China, where growth accelerated from low to mid-single digits over the period, supported by gradually stabilising market conditions. L’Oréal outperformed the market both online and ofline. In a selective market that saw a clear recovery in the second half […] L’Oréal Paris once again confirmed its position as the number one beauty brand in the Chinese market.
p. 44 · Read in context →
L'Oréal's stated China strategy: further customer acquisition and deeper expansion into medium-sized towns where its market share has traditionally been lower.
L'Oréal believes that China harbours great potential for the future. The country’s sheer size opens up a host of opportunities for customer acquisition. The ambition is to make further inroads into medium-sized towns, where the Group has traditionally had a smaller market share than in the biggest cities.
p. 30 · Read in context →
The Estée Lauder Companies (EL)
Global prestige-beauty leader with heavy China exposure; its earnings calls track the size, recovery and online-platform dynamics of the Chinese beauty market that Yatsen's skincare brands contest.
Estée Lauder's CFO characterises China as one of the largest global beauty markets and describes a return to mid-single-digit retail growth with share gains.
Akhil Shrivastava (CFO): What we find encouraging is definitely the situation in China, where the market has expanded, and we have achieved mid-single-digit growth in retail. This is significant because China is one of the largest beauty markets globally, and it wasn't the same in the first half of the year. With two consecutive quarters of mid-single-digit growth and gaining market share, we feel more confident, considering external geopolitical issues that are beyond our control.
p. 12 · Read in context →
Estée Lauder's CEO claims number-one prestige rankings on Tmall and Douyin in China alongside four consecutive quarters of category share gains.
Stéphane de La Faverie (President & CEO): it's now the fourth consecutive quarter that we grew share in all four categories in China. […] the Estee Lauder brand became again the number one prestige brand on Tmall and Douyin, La Mer is the number one brand in luxury on Tmall, and Jo Malone, the number one brand in prestige France is on Tmall.
p. 9 · Read in context →
Botanee (Winona) (300957.SZ)
China's leading functional/dermatological-skincare group (Winona/薇诺娜); a direct domestic online-skincare competitor whose share disclosures size the category Yatsen's skincare brands are pushing into.
Botanee cites Euromonitor data putting its Winona (薇诺娜) brand at about 19.4% of China's dermatological-skincare category, ranked first for consecutive years.
根据 Euromonitor 的统计数据显示,报告期内,公司旗下“薇诺娜(Winona)”品牌在国内皮肤学级护肤品赛道的市场份额约 19.4%,连续多年稳居第一
p. 2 · Read in context →
Botanee on channel mix: Douyin was its fastest-growing channel in the first half, within an online-led, OMO omnichannel model.
渠道拆分来看的话,抖音相对增长最快,上半年增长了7.4%。公司坚持以线下渠道为基础,以线上渠道为主导,通过“OMO”的深度私域运营成功带动串联线上线下融合的全渠道销售模式
p. 1 · Read in context →
More peer documents
Shanghai Jahwa (600315) — Q3 2025 earnings call — 7 pages · Domestic heritage-beauty peer's aggressive online pivot: beauty revenue +272.3%, domestic online +173.3%, three products past ¥100m GMV, and Herborist 'Xiancao Oil' topping Tmall/Taobao/Douyin charts. · Open →
Shanghai Jahwa (600315) — FY2024 annual report — 234 pages · Industry section sizes the China cosmetics category (retail −1.1% in 2024) and lays out a 'focus on core brands / online / efficiency' strategy that overlaps Yatsen's DTC model. · Open →
Bloomage Biotech (688363) — FY2024 annual report — 317 pages · Sizes the 2024 China cosmetics market (¥774.6bn, with online/offline split) and details a multi-brand hero-SKU functional-skincare playbook (润百颜, 夸迪) competing with Yatsen's skincare push. · Open →
Estée Lauder — FY2025 Form 10-K — 246 pages · MD&A and risk factors on mainland-China softness, subdued Chinese consumer sentiment, and beauty competition on price, promotion and e-commerce (with China named explicitly). · Open →
L'Oréal — FY2024 Universal Registration Document — 448 pages · Prior-year North Asia narrative: negative 2024 China beauty-market growth and mass Consumer Products slightly underperforming — the downturn backdrop to the 2025 recovery. · Open →
Proya (603605) — 2025 results briefing — 7 pages · GM Hou Yameng on the multi-brand matrix (Timage as 2025 No.1 Tmall domestic-brand foundation) and a 2026 outlook of premium/mass consumption stratification and domestic substitution. · Open →
Shanghai Chicmax (2145) — FY2024 annual report — 262 pages · Prior-year comparable: KANS ranked #2 in online GMV among domestic brands and #1 in growth rate, establishing the rising trajectory into 2025. · Open →
Botanee (300957) — Q1 2026 investor call — 2 pages · Refined platform-by-platform operations across Douyin, Tmall and JD, adjusting product mix and livestream-host selection — the online channels Yatsen competes on. · Open →
Source: S&P Capital IQ consensus via Xpressfeed · Generated 2026-07-29.
S&P's consensus tape on Yatsen is thin and moving the wrong way on profits: FY27 normalized EPS has been cut from 4.54 to 3.01 over six months while the revenue line barely moves, a margin-driven downgrade rather than a demand one. The forward model still pencils a turn to profitability, with EBITDA and net income swinging positive by FY27, but it rests on one to two analysts per line and a single price target. History shows the company clears revenue consensus consistently while normalized EPS prints swing violently around it.
Coverage is thin: one to two analysts per line
No metric in the feed is covered by three or more analysts, so the disagreement view is unavailable and outer-year figures rest on a single estimate. Read every forward number as one or two models, not a settled consensus.
FY27 normalized EPS cut ~20% in 90 days while revenue holds flat
The downgrade is concentrated in profitability, not the top line — consensus is repricing margins, not demand.
Currency: CNY · Scale: money in millions, absolute · Point-in-time consensus; Δ90d is Now versus 90d.
| Metric | FY | 180d | 90d | 30d | Now | Δ90d |
|---|---|---|---|---|---|---|
| EPS (normalized) | FY2027 | CNY 4.54 | CNY 3.77 | CNY 3.01 | CNY 3.01 | -20.2% |
| Revenue | FY2027 | CNY 5.69bn | CNY 5.71bn | CNY 5.73bn | CNY 5.73bn | +0.4% |
Consensus models a profit turn by FY27 as revenue growth decelerates to ~9%
FY25 blends actuals with estimates, and the swing to positive EBITDA and net income is a forecast, not a result. Revenue growth cools from roughly 22% into FY26 to about 9% into FY27.
Currency: CNY · Scale: money in millions, absolute · YoY uses the prior fiscal year from the feed; analyst count and range use the first displayed period.
| Metric | FY2025A | FY2026E | FY2027E | YoY | Analysts | Low / high |
|---|---|---|---|---|---|---|
| Revenue | CNY 4.25bn | CNY 5.24bn | CNY 5.73bn | — | 2 | CNY 4.16bn / CNY 4.33bn |
| EBITDA | CNY 10.00m | CNY 80.00m | CNY 282.00m | — | 1 | CNY 10.00m / CNY 10.00m |
| Net income (normalized) | CNY 107.00m | CNY 147.00m | CNY 282.00m | — | — | — |
| EPS (normalized) | CNY 1.03 | CNY 1.56 | CNY 3.01 | — | 2 | CNY 0.95 / CNY 1.11 |
Revenue beats every recent print; normalized EPS swings wildly around it
Recent revenue surprises are all positive; normalized EPS surprises range from +116% to -367%, so the EPS line carries little predictive weight. The last quarter shown has no captured consensus.
Current sequences by metric: Revenue: 3 consecutive beats; EPS (normalized): 2 consecutive misses.
Currency: CNY · Scale: money in millions, absolute · Consensus is captured before each actual first became effective.
| Quarter | Metric | Consensus | Actual | Surprise | Outcome |
|---|---|---|---|---|---|
| Q1 FY2024 | EPS (normalized) | -CNY 0.55 | -CNY 0.78 | -41.8% | Miss |
| Q4 FY2023 | EPS (normalized) | -CNY 0.80 | -CNY 1.70 | -112.5% | Miss |
| Q3 FY2023 | EPS (normalized) | -CNY 0.30 | -CNY 0.30 | +0.0% | Met |
| Q2 FY2023 | EPS (normalized) | CNY 0.15 | -CNY 0.40 | -366.7% | Miss |
| Q1 FY2023 | Revenue | CNY 668.00m | CNY 765.40m | +14.6% | Beat |
| Q1 FY2023 | EPS (normalized) | -CNY 0.72 | -CNY 0.25 | +65.5% | Beat |
| Q4 FY2022 | Revenue | CNY 993.00m | CNY 1.01bn | +1.3% | Beat |
| Q4 FY2022 | EPS (normalized) | -CNY 1.93 | CNY 0.30 | +115.6% | Beat |
| Q3 FY2022 | Revenue | CNY 806.00m | CNY 857.90m | +6.4% | Beat |
| Q3 FY2022 | EPS (normalized) | -CNY 1.43 | -CNY 1.10 | +22.8% | Beat |
A single analyst covers the tape: one Buy, 27.12 target
One analyst, one Buy, one 27.12 target — treat street signals here as anecdote, not consensus.
Currency: CNY · Scale: money in millions, absolute · Analyst counts shown explicitly.
| Street view | Reading | Analysts |
|---|---|---|
| Recommendation mix | Buy 1, Outperform 0, Hold 0, Underperform 0, Sell 0 | 1 |
| Consensus score | 1.00 | 1 |
| Target price | mean CNY 27.12; median CNY 27.12; high CNY 27.12; low CNY 27.12 | 1 |
Visible Alpha broker models via S&P Xpressfeed · 1 brokers · 201 line items · freshest revision 2024-04-12.
One broker, revised April 2024 — read as a single stale model, not consensus
Every figure below comes from one analyst's model whose newest revision is April 2024, so nothing here reflects recent trading. There are no company-specific metrics, segment splits or unit KPIs — only a standardized P&L — and with a single broker there is no dispersion to represent disagreement. Treat the whole tab as one dated opinion.
The modeled story is operating leverage, not gross margin: op margin steps from ~4% to ~6%
Revenue compounds in the high-single to low-double digits while selling & marketing rises more slowly, lifting operating margin from 4.0% in FY-2025 to about 6% thereafter. The gross margin does no work — it is held constant — so the entire margin story is spend discipline below the gross line.
| Line | FY-2025A | YoY | Brokers |
|---|---|---|---|
| Top line | — | — | — |
| Total revenue | CN¥4.14bn | — | 1 |
| Total revenue, YoY(%) | 11.0% | — | 1 |
| Profitability | — | — | — |
| Selling & marketing expense | CN¥2.11bn | — | 1 |
| Operating income/(loss) | CN¥163.92m | — | 1 |
| Operating margin(%) | 4.0% | — | 1 |
| EBITDA | CN¥574.14m | — | 1 |
| EBITDA margin(%) | 13.9% | — | 1 |
Earnings and cash inflect together: FCF crosses to positive and net cash keeps building
Free cash flow moves from slightly negative in FY-2025 to positive from FY-2026, and the company sits in a net-cash position that deepens each year. EPS roughly doubles over the window, though off the same single, dated model.
| Line | FY-2025A | YoY | Brokers |
|---|---|---|---|
| Earnings | — | — | — |
| EPS Diluted, Applicable to common stockholders(CNY) | CN¥1.48 | — | 1 |
| Net income/(loss), Applicable to common stockholders | CN¥162.58m | — | 1 |
| Cash | — | — | — |
| Free cash flow (FCF) | CN¥-25.53m | — | 1 |
| FCF margin(%) | -0.6% | — | 1 |
| Net cash flows provided by/(used in) operating activities | CN¥178.51m | — | 1 |
| Cash & cash equivalents | CN¥568.23m | — | 1 |
| Net debt | CN¥-1.43bn | — | 1 |
The flat 74.4% gross margin is an assumption, not a forecast
Gross margin is held at exactly 74.4% in FY-2025 through FY-2028. For a Chinese beauty name where brand mix and channel economics are the real debate, holding the gross line constant is a modeling shortcut — it means every margin call in this model lives in S&M and G&A, not in the product itself.
Headline P&L consensus, momentum and beat/miss live in the CapIQ tab.
Source: S&P Capital IQ transcripts via Xpressfeed · latest indexed call 2026-05-26 · generated 2026-07-29.
Latest call digest
Yatsen Holding Limited, Q1 2026 Earnings Call, May 26, 2026 · 2026-05-26T11:30:00
Yatsen's Q1 2026 call (May 26, 2026) paired strong top-line momentum with a quiet return to losses. Management led with 22.5% revenue growth, a 58.5% jump in skincare and a record 80.2% gross margin, framed around its three pillars of R&D-led innovation, brand equity and profitability. The prepared remarks stayed confident on margins, but the quarter itself slipped back into the red: a net loss of RMB 61.9 million versus RMB 5.6 million a year earlier, as the selling and marketing expense ratio rose to 72.2% from 66.4% on higher Douyin traffic costs. The CFO guided Q2 2026 revenue to RMB 1.2 billion to RMB 1.3 billion, up roughly 10% to 20%. Notably, the two analysts on the line did not press on the profit reversal, focusing instead on skincare expansion, foreign competition and DR. WU's drivers. Management also confirmed it completed the first tranche of a convertible-notes and warrants private placement on May 21, 2026, adding Hillhouse as a participating investor.
Participant coverage from the latest call.
| Group | Participants | Count |
|---|---|---|
| Management | Operator; Irene Lyu — Head of Strategic Investments & Capital Markets, Yatsen Holding Limited; Jinfeng Huang — Founder, CEO & Chairman of the Board of Directors, Yatsen Holding Limited; Donghao Yang — CFO & Director, Yatsen Holding Limited | 4 |
| Analysts | Manqi Huang — Associate, China International Capital Corporation Limited, Research Division; Lin Zhang — Beauty & Commerce Analyst, Citic Securities Co., Ltd., Research Division | 2 |
Curated latest-call exchanges; one row per analyst topic.
| Analyst | Firm | Topic | What changed in Q&A |
|---|---|---|---|
| Maggie Huang | CICC | Skincare expansion & foreign competition | Asked how the skincare portfolio expands from here and how Yatsen views high-end foreign rivals; management pointed to building routines around proven hero product families and differentiating through R&D and AI-driven efficiency rather than higher spend. |
| Lin Zhang | Citic Securities | DR. WU growth drivers | Asked what is driving DR. WU's fast growth; management credited a higher B2B, professional and offline channel mix that balances growth, traffic cost and profitability. |
Theme tracker
Themes are curator-classified across supplied calls.
| Theme | Status | Quarters mentioned | Read-through |
|---|---|---|---|
| Skincare-led category upgrade | persisted | Q2 2024, Q3 2024, Q4 2024, Q1 2025, Q2 2025, Q3 2025, Q4 2025, Q1 2026 | Skincare has been the consistent growth engine, with its revenue share climbing to 61.1% of total in the fourth quarter of 2025 and skincare revenue up 58.5% in Q1 2026; the mix shift is the main lever behind rising gross margin. |
| R&D-led innovation | persisted | Q2 2024, Q3 2024, Q4 2024, Q1 2025, Q2 2025, Q3 2025, Q4 2025, Q1 2026 | R&D is management's framing in every call and is credited as the source of the skincare pipeline; R&D expense ran close to 4% of revenue in the most recent quarters (3.9% in Q1 2026). |
| Path to profitability and margin optimization | persisted | Q2 2024, Q3 2024, Q4 2024, Q1 2025, Q2 2025, Q3 2025, Q4 2025, Q1 2026 | Margin optimization recurs every quarter; the company reached full-year 2025 non-GAAP net income (0.2% margin), but Q1 2026 slipped back to a net loss as the marketing expense ratio rose. |
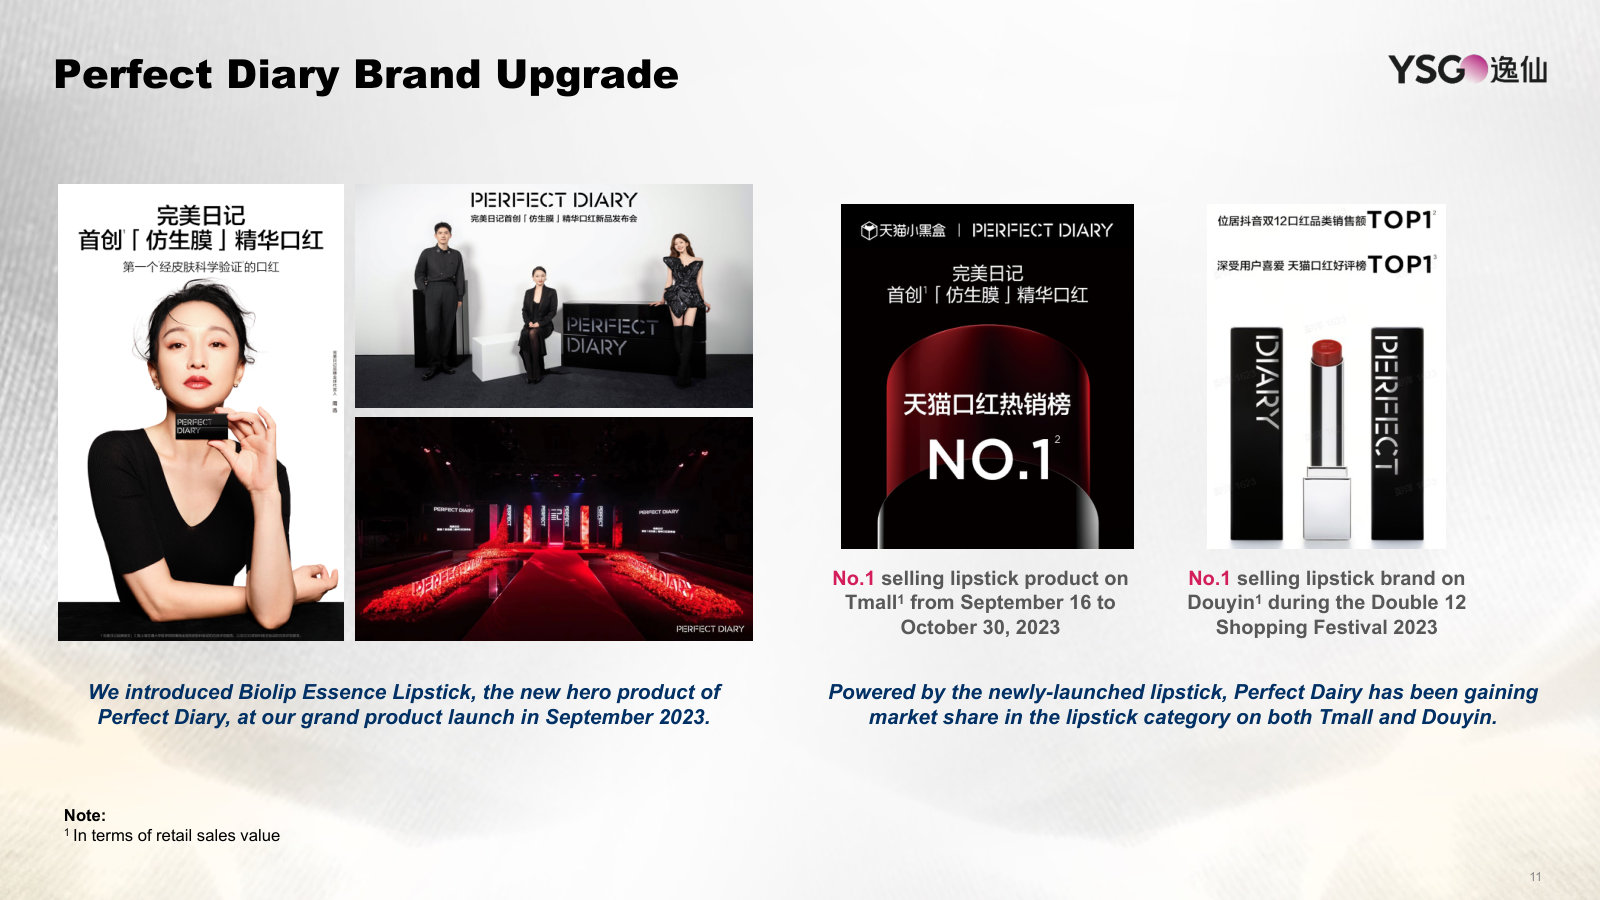
| Perfect Diary / color-cosmetics recovery | dropped | Q2 2024, Q3 2024, Q4 2024, Q1 2025, Q2 2025, Q3 2025 | Perfect Diary's turnaround was a headline theme in prepared remarks through Q3 2025 but disappeared from the Q4 2025 and Q1 2026 remarks, as color cosmetics revenue turned down again (down 5% in Q1 2026). |
| Competition from foreign high-end brands | persisted | Q2 2025, Q3 2025, Q1 2026 | As Yatsen's skincare premiumized, competition from high-end foreign brands became a standing analyst question; management consistently frames its edge as R&D and product differentiation rather than price. |
| Convertible-notes financing | emerged | Q1 2026 | New in Q1 2026: management said it completed the first tranche of a convertible-notes and warrants private placement on May 21, 2026, adding Hillhouse alongside the CEO and Trustar Capital, a capital raise surfacing just as the company returned to a loss. |
Guidance ledger
Quotes, calls, and speakers are source-verified; outcomes are curator-classified.
| Verbatim guidance | Call | Speaker | Curator outcome | Outcome note |
|---|---|---|---|---|
| “we expect our total net revenues to be between RMB 1.2 billion and RMB 1.3 billion, representing a year-over-year increase of approximately 10% to 20%” | Yatsen Holding Limited, Q1 2026 Earnings Call, May 26, 2026 · 2026-05-26T11:30:00 | Donghao Yang | pending | Guidance for Q2 2026; the Q2 2026 results were not reported within the supplied call history. |
| “we expect our total net revenues to be between RMB 958.6 million and RMB 1.08 billion, representing a year-over-year increase of approximately 15% to 30%” | Yatsen Holding Limited, Q4 2025 Earnings Call, Mar 02, 2026 · 2026-03-02T12:30:00 | Donghao Yang | kept | Q1 2026 revenue came in at RMB 1.02 billion, up 22.5%, within the guided range. |
| “we expect our total net revenues to be between RMB 1.32 billion and RMB 1.49 billion, representing a year-over-year increase of approximately 15% to 30%” | Yatsen Holding Limited, Q3 2025 Earnings Call, Nov 17, 2025 · 2025-11-17T12:30:00 | Donghao Yang | kept | Q4 2025 revenue was RMB 1.38 billion, up 20.1%, within the guided range. |
| “we expect our total net revenues to be between RMB 778.6 million and RMB 880.1 million, representing a year-over-year increase of approximately 15% to 30%” | Yatsen Holding Limited, Q2 2025 Earnings Call, Aug 21, 2025 · 2025-08-21T11:30:00 | Donghao Yang | kept | Q3 2025 revenue reached RMB 998.4 million, up 47.5%, above the top of the guided range. |
| “we expect our total net revenues to be between RMB 810.4 million and RMB 889.9 million, representing a year-over-year increase of approximately 2% to 12%” | Yatsen Holding Limited, Q1 2025 Earnings Call, May 16, 2025 · 2025-05-16T11:30:00 | Donghao Yang | kept | Q2 2025 revenue was RMB 1.09 billion, up 36.8%, well above the guided range. |
| “we expect our total net revenues to be between RMB 788.8 million and RMB 866.2 million, representing a year-over-year increase of approximately 2% to 12%” | Yatsen Holding Limited, Q4 2024 Earnings Call, Feb 25, 2025 · 2025-02-25T12:30:00 | Donghao Yang | kept | Q1 2025 revenue was RMB 833.5 million, up 7.8%, within the guided range. |
| “we may repurchase up to $30 million worth of our ordinary shares over the next 24 months, commencing on May 16, 2025” | Yatsen Holding Limited, Q1 2025 Earnings Call, May 16, 2025 · 2025-05-16T11:30:00 | Jinfeng Huang | unknown | Up to $30 million buyback authorized over 24 months from May 16, 2025; the supplied calls do not disclose amounts subsequently repurchased. |
Q&A pressure map
Question counts and firms are curator tallies; analyst coverage shown above.
| Topic | Questions | Firms | Pressure / response |
|---|---|---|---|
| Profitability and margin improvement | 7 | CICC, Citic Securities | The most pressed theme across the last two years. Analysts repeatedly asked how Yatsen would lift margins while sustaining growth; management consistently answered with the higher-margin skincare mix, product and channel optimization, and operating leverage. |
| Skincare growth drivers and portfolio expansion | 5 | CICC, Citic Securities | Analysts frequently probed how the skincare surge is sustained and expanded; management pointed to R&D, hero-product families and channel-mix balance, notably DR. WU's B2B and professional tilt. |
| Competition from foreign high-end brands | 3 | CICC | As skincare premiumized, CICC repeatedly raised competition from high-end foreign brands; management acknowledged intense, price-led competition but argued its R&D and differentiation let it compete without simply spending more. |
| Shopping-festival performance | 5 | CICC | Double 11, 618 and Women's Day results were a recurring CICC question; management characterized outcomes as in line with expectations each time and, in Q1 2024, declined to give segment-level growth forecasts beyond quarterly revenue guidance. |
Language shifts
Only language evidence verified against the referenced component is shown.
| Observation | Verbatim evidence | Call ID | Component |
|---|---|---|---|
| After several quarters of turnaround language, Q1 2026 reintroduced explicit caution on marketing costs, flagging higher Douyin traffic acquisition as a drag even as growth stayed strong. | “our selling and marketing expenses as a percentage of total net revenues experienced an increase as a result of both the continued investment in building our core brands and the elevated industry-wide traffic acquisition costs on the Douyin platform” | 2001072138 | 2 |
| In Q1 2025 management adopted confident turnaround language, marking the swing back to non-GAAP profitability. | “we achieved a non-GAAP net income of RMB 7.1 million, representing a significant turnaround from the non-GAAP net loss of RMB 83.8 million for the prior year period” | 1942901159 | 2 |
| By Q3 2025 the CEO's language on competition sharpened, describing high-end rivals resorting to deep discounting rather than downplaying the threat. | “some of the high-end brands are struggling with very big and also deep price cut for their hero products” | 1969803192 | 6 |
| Even with the quarter back in the red, Q1 2026 held an unwavering-confidence register on margins. | “our commitment to long-term profitability optimization remains unwavering” | 2001072138 | 2 |
The call history shows a company that has convincingly rebuilt its top line around skincare and R&D, but the return to a net loss in Q1 2026, alongside a fresh convertible-notes raise, is a reminder that profitability remains fragile and dependent on marketing discipline that slipped this quarter. The unusually soft Q&A left that tension underexamined.
Yatsen Holding is the Guangzhou beauty group behind Perfect Diary — a November 2020 IPO darling whose shares have fallen about 93% since. It now carries roughly ¥1.0 billion of net cash and no debt, is controlled by its founder (90% of the vote), and in 2025 returned to growth (+27%) with operating losses all but erased. Whether that stabilization is durable, self-funding profitability, or a still-cash-burning turnaround spending its IPO windfall, is what this report tests.
Figures are stated in Renminbi (¥), the currency in which Yatsen reports its financial statements. Where useful, the company's own US-dollar convenience translations and the US-dollar share price are given alongside.
What Yatsen is
Yatsen Holding Limited is a Cayman-incorporated, Guangzhou-headquartered beauty company that develops and sells color cosmetics and skincare through a portfolio of owned brands — Perfect Diary, Little Ondine, Pink Bear and Abby's Choice in cosmetics; Galénic, DR.WU, Eve Lom and others in skincare — and lists on the NYSE as a foreign private issuer, filing on Form 20-F [1]. It sells mostly direct to the consumer online: sales to end customers were 85% of revenue in 2025 [2].
The business reports in two segments. Color Cosmetics — led by Perfect Diary, the brand the company was built on — generated ¥2,005.9 million in 2025. Skincare Brands generated ¥2,277.3 million and, for the first time, is the larger of the two, having grown 63% year on year [3]. That crossover reflects a color-cosmetics business that collapsed after 2021 and has been rebuilt around skincare.
Sources: FY2022 20-F, Segment Information [4] for 2021–2022; FY2025 20-F [5] for 2023–2025.
Total revenue tells the fuller arc. Yatsen peaked at ¥5.84 billion in 2021, then nearly halved as Perfect Diary's traffic-bought growth reversed [6]. Revenue bottomed near ¥3.4 billion in 2023–2024 and recovered to ¥4,298.1 million (US$614.6 million) in 2025 — still a quarter below the peak, but the first genuine growth year since the boom broke [7].
The crash
Yatsen priced its IPO at US$10.50 per ADS on November 23, 2020, raising net proceeds of about US$577 million, with each ADS then representing four Class A ordinary shares. The offering drew a marquee syndicate of existing backers — Hillhouse Capital, Tiger Global, Tencent and Yunfeng — subscribing to roughly 37% of the deal [8]. Adjusting for a later change in the ADS ratio to twenty shares, the stock trades near US$3.43, roughly 93% below that IPO price on a per-ordinary-share basis, valuing the equity at about US$320 million.
The decline was severe enough to threaten the listing itself. Yatsen received NYSE notices in April 2022 and again in November 2023 that its ADSs had fallen below the exchange's US$1.00 minimum-price standard; it cured both, the second time by raising the ADS-to-share ratio from four to twenty — a mechanical five-fold lift to the quoted price [9]. For a reader weighing downside, the delisting notices are the low point of the record; the balance sheet below is the reason the company had the room to fix it.
The turnaround, measured
The loss line has narrowed faster than revenue has grown. Reported operating loss fell from ¥928.9 million in 2022 [10] to ¥185.8 million (US$26.6 million) in 2025, and net loss attributable to shareholders fell from ¥815.4 million to ¥80.9 million (US$11.6 million) over the same span [11]. The 2023 and 2024 operating losses each carried a large non-cash goodwill impairment (¥354.0 million and ¥403.1 million); stripping those out, the underlying operating loss still narrowed each year [12].
Sources: FY2023 20-F, Consolidated Statements of Operations [13] for 2022; FY2025 20-F [14] for 2023–2025. Net loss is the amount attributable to Yatsen shareholders; 2023–2024 operating loss includes goodwill impairment.
Two forces drove the improvement. Gross margin climbed from about 68% in 2022 to 78.2% in 2025 as the mix shifted toward higher-priced skincare [15]. The counterweight is that selling and marketing still absorbed 66% of revenue in 2025 — the legacy of a business model built on buying online traffic, and, at 66% of revenue, the largest reason the company has not yet reached breakeven despite a nearly 80% gross margin [16]. The read here is that the turnaround is real in the accounting but not yet proven in cash: what would settle it is a year in which marketing intensity falls without revenue stalling.
The balance sheet, and where the cash went
The reason the equity is worth studying at this price is the balance sheet. At the end of 2025 Yatsen held ¥765.4 million of cash and equivalents plus ¥246.0 million of short-term investments — roughly ¥1.0 billion (about US$145 million) of liquid assets against no bank borrowings [17]. Against a market value near US$320 million, net cash is close to half the price, and the company also carries a further ¥653.6 million of longer-term investments not counted here [18].
That cash pile has been shrinking, and it matters how. Liquid assets fell from about ¥2.6 billion at the end of 2022 to ¥1.05 billion at the end of 2025. Of that decline, the larger part was deliberate capital return: Yatsen spent roughly ¥730 million buying back stock over 2023–2025, and operations consumed a further ¥446 million; operating cash flow was negative in each of the three years (−¥94.7 million in 2025) [19].
Source: derived from FY2025 20-F, cash-flow and balance-sheet data [20].
The buybacks have been substantial relative to the company's size: 40.2 million ADSs repurchased for US$202.2 million through February 2026 — a sum on the order of two-thirds of the entire current market capitalization [21]. The favorable read is a management team retiring stock at depressed prices; the caution is that a loss-making company has been returning capital while still burning it in operations, and the newest program, authorized in 2025, is far smaller (US$30 million) than its predecessors.
Founder control
Yatsen is a founder-controlled company. Jinfeng (David) Huang — founder, chairman and CEO — held 32.0% of the shares but 90.4% of the voting power as of February 2026, through a dual-class structure that gives his Class B shares twenty votes each [22]. At the IPO he held 24.9% of shares and 63.7% of the vote [23]; the years of buybacks, which retired Class A shares and left his Class B holding intact, have tightened his control rather than loosened it.
For an investor who prizes owner-operators, the alignment is genuine — the founder's economic stake dwarfs any outside holder's. The same structure, though, means minority holders cannot force a sale, a board change or a capital-return policy; on any contested question, Mr. Huang decides. That is a feature for a reader who trusts the operator and a risk for one who does not, and it is why the questions of what management is paid and how it has spent capital sit near the center of this case.
The through-line
The question this report exists to answer is whether Yatsen's post-crash stabilization — re-accelerating, skincare-led revenue and near-eliminated operating losses, sitting on net cash and no debt under a controlling founder — is the start of durable, self-funding profitability worth more than the cash on its books, or a still-cash-burning turnaround that is returning its IPO windfall to shareholders faster than the business is earning it. The chapters that follow test the two halves of that question in turn: the quality and durability of the operating recovery, and the margin of safety the balance sheet and the founder actually provide.
Market cap, US$m (approx.)
Net cash, US$m
Founder voting power
Cumulative buybacks, US$m
Sources: market capitalization derived from ADS price (company filings and market data, as reported) and shares outstanding; net cash and buybacks from FY2025 20-F [24] [25]; founder voting power from FY2025 20-F [26].
Yatsen's operating recovery is real but not yet self-funding. In 2025 revenue grew 26.7%, gross margin reached 78.2%, and non-GAAP net income turned positive — ¥8.4 million — for the first time [1]. Yet operations still consumed ¥94.7 million of cash, the one profitable quarter leaned on non-operating income, and in the first quarter of 2026 a push for 22.5% growth sent marketing back above 72% of revenue and reopened the loss.
Figures are stated in Renminbi (¥), the currency Yatsen reports in; the company's own US-dollar convenience translations are given alongside where useful.
The annual turn is genuine, and thin
The three-year income statement shows a business that has stopped deteriorating. Revenue rose 26.7% to ¥4,298.1 million (US$614.6 million) in 2025 after two flat-to-down years, gross margin widened to 78.2% from 77.1% as skincare displaced color cosmetics, and the reported net loss shrank 87% to ¥92.4 million (US$13.2 million) from ¥710.2 million [2]. Most of that headline improvement is the absence of the ¥403.1 million goodwill impairment that fell in 2024; the underlying trend is better read through the company's non-GAAP lines, which exclude impairment, share-based pay and acquisition amortization [3].
Source: Q4 & Full Year 2025 earnings release, full-year results and non-GAAP reconciliation [4] [5].
The swing to a non-GAAP profit is a real inflection — 2024 carried a non-GAAP net loss of ¥128.2 million — but it is a slender one. The ¥8.4 million result is a 0.2% net margin, and it depends on adding back ¥59.0 million of share-based compensation and ¥42.7 million of acquisition-related intangible amortization; on a fully reported basis the company still lost money [6]. At the operating line, 2025 was still a ¥185.8 million loss, or ¥84.0 million excluding the non-cash items — narrower than 2024's ¥224.3 million, but a loss all the same [7].
Revenue growth, 2025
Gross margin, 2025
Non-GAAP net income, ¥m
Operating cash flow, ¥m
Source: Q4 & Full Year 2025 earnings release, full-year results [8].
The recovery is not a straight line
The quarter-by-quarter record is where the durability question actually lives. Revenue has grown year on year every quarter, but the operating line has stayed negative throughout, and profitability tracks the calendar as much as the strategy. The fourth quarter of 2025 was the standout: net revenues jumped 20.1% to ¥1,379.4 million and Yatsen posted its first quarterly net income — ¥3.0 million for the group, ¥8.1 million attributable to shareholders — against a ¥378.8 million loss a year earlier [9].
Source: Q4 2025 and Q1 2026 earnings releases, statements of operations [10] [11].
Two things qualify that milestone. The quarterly net profit sat on top of a still-negative operating margin of 0.9%; the black ink came from below the operating line — financial income and other income — not from the business breaking even on its own costs [12]. And the quarter was flattered by scale: the Double 11 shopping festival lifts fourth-quarter volume enough to spread marketing over a larger revenue base, so selling and marketing fell to 64.8% of revenue even as it rose in absolute terms [13]. A ¥14.6 million out-of-period adjustment correcting prior-period sales-return and inventory errors reduced the quarter's profit, so the underlying figure was modestly better — but it also means the reported number is not a clean run-rate [14].
Source: derived from quarterly statements of operations, Q4 2025 and Q1 2026 earnings releases [15] [16].
The first-quarter 2026 test
The most recent quarter is the first real-time test of whether growth and profitability can move together, and it went the other way. First-quarter 2026 revenue grew 22.5% to ¥1,021.0 million (US$148.0 million), led by a 58.5% rise in skincare, yet the operating loss more than doubled to ¥99.0 million and the operating margin fell to a negative 9.7% — its worst reading in the five quarters shown [17] [18]. The non-GAAP net line swung from a ¥7.1 million profit a year earlier to a ¥57.3 million loss [19].
The cause is direct. Selling and marketing rose to 72.2% of revenue from 66.4% a year earlier, which management attributed to investments in brand equity for its core brands and higher traffic-acquisition costs on the Douyin platform [20]. The pattern holds across the year: marketing intensity falls when the seasonal revenue surge does the work, and rises when the company pays to grow. Away from the fourth-quarter peak, selling and marketing runs in the low-to-mid 70s as a share of revenue, and a gross margin near 80% is not wide enough to cover it.
Source: Q4 2025 and Q1 2026 earnings releases, operating-expense detail [21] [22].
Cash generation still lags
Reported profit and cash generation have diverged in Yatsen's favor at times and against it at others, so the cash statement is the harder test of self-funding, and it has not yet been passed. Operating cash flow was negative in the peak quarter (¥69.4 million used in the fourth quarter of 2025) and negative again in the first quarter of 2026 (¥90.0 million used, against ¥23.8 million generated a year earlier) [23] [24]. Liquid assets — cash, restricted cash and short-term investments — fell from ¥1.05 billion at the end of 2025 to ¥934.2 million three months later [25].
The clearest signal against the self-funding read arrived in May 2026: Yatsen completed the first closing of a private placement of convertible notes and warrants worth roughly US$120 million, taken up by Trustar Capital, Hillhouse and founder-CEO Jinfeng Huang [26]. A company that carries net cash and no debt (After the Crash) has chosen to raise convertible capital while still burning cash — a step that funds the growth ambition but sits awkwardly against the idea that the business is now paying its own way.
What is modeled ahead
Management guides revenue, and only revenue. Its first-quarter 2026 forecast of ¥958.6 million to ¥1.08 billion was met, and it guided second-quarter 2026 revenue to ¥1.20–1.30 billion, a 10% to 20% year-on-year increase [27] [28]. Notably, no guidance is offered on margins, losses or the timing of profitability; the CFO's stated aim is that "top-line expansion efficiently translates into future margin improvement," without a date attached [29].
Sources: management guidance from Q1 2026 earnings release, Business Outlook [30]; forward-revenue figures are consensus estimates, as reported.
The forward view carries an important caveat: sell-side coverage of Yatsen is effectively a single analyst, so the consensus revenue path — roughly ¥5.2 billion in 2026 and ¥5.7 billion in 2027 — should be read as one modeler's assumption, not a market view, and the consensus earnings figures are too thinly covered to lean on. What the numbers do establish is a growth story without a committed profitability timeline: management will forecast the top line and describe margin improvement as an aspiration, but has not put a breakeven date on the record.
The evidence points one way for now. The mix shift to skincare and the near-80% gross margin are durable and improving; the operating recovery is real. But self-funding profitability is not yet demonstrated — the business earns money only when seasonal volume subsidizes a fixed-heavy marketing base, it still burns operating cash, and it has just raised convertible capital to keep growing. The case is most sensitive to two signals: selling and marketing falling as a share of revenue while revenue still grows, and operating cash flow turning durably positive. The first quarter of 2026 tested both, and both moved the wrong way.
Marketing Economics
The marketing line is the whole story: at 66.3% of revenue it is both the ~22-point operating-margin gap to profitable peer Proya and the ~¥900m swing between value trap and re-rating on ~¥5.5bn of sales, while Yatsen spends about 21 times as much on marketing as on R&D — so the step-down the upside depends on has no product moat visibly behind it [1]. At its 2020 IPO Yatsen sold a data-driven, direct-to-consumer platform whose rising repeat-purchase rates were the edge; five years on it no longer discloses those cohort metrics, selling and marketing still runs about two-thirds of revenue, and its two most platform-dependent cost lines are growing faster than sales.
On the ~¥5.5bn of revenue consensus expects across 2026–27, moving selling and marketing from 66% of revenue toward Proya's ~46% spans roughly a -5% to +12% operating margin, or about ¥900 million of operating profit. Cashed out at a mid-teens EV/EBIT in the arithmetic of Valuation and Cash, that span is the difference between roughly today's ~US$322 million market capitalization and a multiple of it. The counter sits in the same figures: gross margin is already 78.2% [2] and research runs about 3% of revenue (Product Engine), broadly in line with L'Oréal, so a richer skincare mix could pull the marketing-to-R&D ratio down with a lag rather than leave it fixed.
Figures are stated in Renminbi (¥), the currency in which Yatsen reports. The company's own US-dollar convenience translations are given alongside where its filings provide them.
The edge Yatsen sold at IPO
The listing document made a specific claim: that Yatsen was not just another brand buying attention, but a technology-enabled platform whose customers came back on their own. It quantified the point with cohort data. Of the customers who first bought a Yatsen product in the third quarter of 2017, 8.1% made a repeat purchase within a year; for the third-quarter 2018 cohort that figure reached 38.9%, and for the third-quarter 2019 cohort 41.5% — a repeat rate the company said exceeded its peers, powered by a database of customer insights and an in-house team of over 200 engineers [3]. Perfect Diary had become the No. 1 color-cosmetics brand by GMV on Tmall within 13 months of launch, and the pitch was that this playbook — data, KOL marketing, omni-channel scale — would repeat across brands [4].
The market backdrop was, and remains, genuinely large. At IPO the company cited third-party research putting China's beauty market on a path to US$68.7 billion by 2024, growing at a 10.0% compound rate — roughly three times the pace of the United States — with domestic brands taking share from multinationals among Gen-Z and millennial buyers [2]. That tailwind is real and is the reason a sub-scale, loss-making company can still grow 27% in a year. But a rising-tide market is available to every competitor in it; the question this chapter examines is whether Yatsen captures that demand cheaply enough to keep it, or must keep spending at the same rate to hold sales.
Marketing intensity has not moved in six years
The cleanest test is the simplest: selling and marketing as a share of revenue. Through the 2021 boom, the 2022–2023 collapse, the wind-down of hundreds of offline stores, the pivot from color cosmetics to skincare, and the 2025 recovery, that ratio has never left a narrow band between roughly 63% and 69%.
Sources: FY2022 20-F [5] for 2020–2022; FY2025 20-F [6] for 2023–2025.
The company incurred ¥3.41 billion, ¥4.01 billion and ¥2.33 billion of selling and marketing expense in 2020, 2021 and 2022 — 65.2%, 68.6% and 62.9% of revenue [7], then ¥2.23 billion, ¥2.27 billion and ¥2.85 billion (US$407.9 million) in 2023, 2024 and 2025 — 65.3%, 66.9% and 66.3% [8]. The one visible dip, to 62.9% in 2022, came not from customers getting cheaper to reach but from Yatsen actively cutting — closing underperforming stores and trimming marketing events as revenue fell [9]. A repeat-purchase moat of the kind the IPO described would show up here as a falling ratio over time, as an installed base of loyal buyers carried more of each year's sales. That is not what the record shows. Notably, the cohort repeat-purchase disclosures that anchored the IPO story no longer appear in the annual report; the disclosure that would most directly prove or disprove the moat is no longer reported.
Platform-linked costs are rising faster than sales
Inside the 2025 marketing line, the two components most tied to third-party platforms grew faster than revenue did. Advertising, marketing and brand-promotion costs rose from ¥1.37 billion to ¥1.83 billion (US$261.6 million), which the company attributes partly to "higher traffic acquisition costs amid intensified competition." Platform commissions — the cut paid to Tmall, Douyin, JD and the rest — rose from ¥357.1 million to ¥512.6 million (US$73.3 million) [10]. Against revenue growth of 26.7%, advertising and promotion grew 33.6% and platform commissions grew 43.6%.
Source: FY2025 20-F, growth computed from reported amounts [11].
The advertising and promotion sub-line is the largest single call on Yatsen's revenue after cost of goods: ¥1.26 billion, ¥1.37 billion and ¥1.83 billion across 2023–2025 [12]. At ¥1.83 billion it equals roughly 43% of all revenue and more than half the gross profit the business generates. Because commissions scale mechanically with sales and traffic must be re-bid against rising competition, operating leverage on marketing has not appeared even as revenue recovered — the pattern a rented, rather than owned, demand base would produce.
A profitable peer runs the same market for far less
The most useful benchmark in the corpus is Proya Cosmetics, the largest listed domestic Chinese beauty group and a digital-first, mass-to-premium operator selling to the same consumers on the same platforms. Proya is what a working version of Yatsen's model looks like. On a nearly identical gross margin, it spends roughly 46% of revenue on selling and administration combined and earns an 18% operating margin — where Yatsen spends about 73% on the same two lines and loses money at the operating level.
Sources: Yatsen FY2025 20-F [13]; Proya Cosmetics FY2025 financials, as reported. Yatsen "selling + admin" combines its 66.3% selling and marketing and 7.1% general and administrative ratios; Proya's figure is its reported selling-plus-administrative expense.
Yatsen selling + admin (% rev)
Yatsen operating margin (2025)
Proya operating margin (2025)
Sources: Yatsen FY2025 20-F [14]; Proya Cosmetics FY2025 financials, as reported.
The comparison is deliberately blunt: Yatsen's gross margin is actually five points higher than Proya's, so nothing about its products or pricing explains the loss. The entire gap — and more — sits in operating spend, and the marketing line dominates it. This is the strongest evidence that 66% is not an industry floor but a company-specific outcome. Proya does compete for the same shoppers and pays the same platforms, yet converts that competition into an 18% margin. Two caveats keep this honest: Proya reports under Chinese accounting standards and lumps selling with administrative expense differently, and it is a larger, older business with more scale to amortize brand-building over. The direction of the gap, however, is too wide to be a definitional artifact.
What could still bend the curve: premiumization
There is a credible path by which the marketing ratio falls, and Yatsen is walking it. The company has rebuilt itself around skincare, which in 2025 became the larger segment for the first time — ¥2,277.3 million against ¥2,005.9 million for color cosmetics, versus a ¥1,973.7 million-to-¥1,383.6 million split the other way in 2023 [15]. Skincare, led by the acquired clinical and premium brands Galénic, DR.WU and Eve Lom, is the kind of efficacy-driven category that can earn repeat demand on results rather than on paid reach. The offline footprint is being reshaped to match: experience stores fell to 77 at the end of 2025 from 88 a year earlier and 114 in 2023, as Perfect Diary locations closed and the Galénic network expanded [16]. Rising gross margin — 78.2% in 2025 [17] — is consistent with a genuinely richer mix.
Two facts temper it. First, the premiumization is already several years old and the marketing ratio has not yet responded — 2025's mix was the most skincare-weighted ever, and selling and marketing still landed at 66.3%. Second, the premium brands were bought, not built, and they have not yet earned their price: Yatsen wrote off ¥354.0 million of goodwill in 2023 and a further ¥403.1 million in 2024 — roughly ¥757 million in cumulative impairment against those acquisitions [18]. The company's own explanation for rising 2024 marketing was structural, not cyclical: a shift of sales onto Douyin, whose channel-traffic costs are higher [19]. And it competes against multinationals — L'Oréal and Estée Lauder among them — with far deeper marketing budgets, which is the force keeping traffic prices high [20].
The read, and what would change it
On the evidence, Yatsen still funds most of its demand through current marketing rather than an installed base: after six years, a full category pivot, and a marketing ratio stuck near two-thirds of revenue while a comparable domestic peer runs at less than half, the burden of proof that a durable customer franchise exists has not been met. It is why the net-cash cushion described in After the Crash is being spent down and why the operating recovery in Path to Breakeven is not yet self-funding: the marketing line consumes the gross profit before it reaches the bottom line.
The read is falsifiable, and cheaply. The signals that would move it: selling and marketing falling decisively out of the low-60s toward Proya's range while revenue still grows; the premium skincare brands sustaining growth with a visibly lower promotion load than legacy Perfect Diary; or a resumption of the cohort repeat-purchase disclosure the company was proud to publish when the numbers flattered it. Absent those, the most likely case is that growth continues to require proportional marketing, and profitability stays a seasonal, below-the-line event rather than a structural one.
Product Engine
Yatsen brands itself "R&D-led," and the science is not a fiction: certified labs, a 269-item patent portfolio, medical and university partnerships, and proprietary ingredients. But the spending and the intellectual property describe a company that mostly buys premium credibility rather than one that builds a defensible product moat. Product research is 3.2% of revenue (¥137.3 million) and has not passed its 2021 peak; selling and marketing outspends it 20.8 to 1; and the patent book tilts toward packaging design.
The marketing economics chapter established that Yatsen's entire operating-margin gap sits in the selling and marketing line — 66.3% of revenue, versus a profitable peer near 46%. That was the demand side: what the company pays to acquire a sale. This chapter is the supply side. The escape route the upside case needs — a premium, skincare-led mix that eventually needs less marketing per sale — has to be powered by something. Management says that something is research. The filings let us size it.
Twenty-to-one
The clearest way to read Yatsen's priorities is its own 2025 operating expense line, expressed against revenue.
Source: FY2025 Annual Report (Form 20-F), Consolidated Statements of Operations [1].
For every ¥1.00 Yatsen spent on research in 2025 it spent ¥20.80 on marketing. That ratio is not a one-year artifact of a growth push: it was 20.0x in 2023 and 20.8x in 2024 [2]. A model that acquires demand at twenty times the rate it develops product is, structurally, a marketing model with a research function attached — not the reverse.
Research Spend (¥m)
% of Revenue
Marketing : Research
Patent Portfolio
Sources: FY2025 Annual Report (Form 20-F), Results of Operations [3] and Business — R&D Capabilities [4].
Rising as a share, flat as a sum
Read on its own, the research budget looks like a rising commitment: from 0.8% of revenue in 2019 to a 3.2% plateau since 2023 — roughly the ~3% of sales that L'Oréal, the industry's largest research force, spends [5]. By that intensity measure Yatsen looks normal for a science-led beauty company.
The absolute figure tells a quieter story. Research spending peaked in 2021 at ¥142.1 million and, four years later, at ¥137.3 million, has still not returned to it [6] [7]. The jump in intensity from 2.4% to 3.4% between 2021 and 2022 was mostly a denominator effect — revenue fell from ¥5.84 billion to ¥3.71 billion in the crash — not a spending surge [8] [9]. In US dollars the 2025 research budget is US$19.6 million.
Sources: FY2021 20-F (2019–2021) [10]; FY2024 20-F (2022) [11]; FY2025 20-F (2023–2025) [12].
Sources: research spend and ratios per the FY2021, FY2024 and FY2025 20-F Results of Operations [13] [14]; patent totals per each year's Business section [15] [16] [17] [18].
Patents that protect the label
The patent count has more than doubled since 2021 — 118 to 269 — which reads as an innovation engine gaining momentum [19] [20]. The composition points the other way. Of the granted patents, design patents — which protect the appearance of packaging, not a formulation — are the majority and the fastest-growing type: 74 in 2021, 158 in 2025. Invention patents, the category that covers proprietary chemistry, grew from 39 to 72 over the same span, staying under a third of the granted book.
Sources: granted-patent counts by type, FY2021–FY2025 20-F Business sections [21] [22] [23] [24] [25].
Yatsen is candid about where its defensibility lies. The FY2025 filing states plainly that "our most valuable intellectual property is our brand names," backed by 2,197 trademarks registered in China and 2,256 outside it [26]. A second qualifier sits in how the products are made: much of Yatsen's formulation work is co-developed with third-party original-design manufacturers — Cosmax, Intercos, Kolmar, Sensient Technologies and Naolys — the same contract labs that serve competitors [27]. Innovation routed through shared suppliers is harder to fence off than innovation done in-house.
What the premium credentials are
The bear reading should not be overstated, because the science infrastructure is real and it is being pointed at the right segment. Yatsen operates a global research center in Shanghai, a certified lab in Guangzhou, a joint laboratory with Ruijin Hospital, and a France facility for the Galénic brand, organized under a "1-3-4-6-20" framework of one manufacturing hub, three research centers, four focus areas, six joint laboratories and over twenty joint projects [28]. It runs partnerships with Huazhong University, Sun Yat-sen University and Lubrizol, and — through the Galénic acquisition — a long-term collaboration with Pierre Fabre, a major European dermo-cosmetics group [29].
Crucially, the acquired premium brands carry formulation heritage Yatsen did not have to build: DR.WU's clinical skin-renewal expertise and Galénic's Pierre Fabre link are genuine credentials, whatever the in-house patent mix looks like [30]. And the strategy is showing up on the one margin line research most directly touches. Gross margin climbed from 73.6% in 2023 to 78.2% in 2025, which management attributes to the growing skincare mix, a category it says "typically feature[s] higher gross margin and greater customer loyalty" than color cosmetics [31] [32].
Source: FY2025 Annual Report (Form 20-F), Results of Operations [33].
Management is explicit that research is the engine, not the accessory. On the Q4 2025 call, the chief financial officer named research as "the most important thing that we're going to do to grow our Skincare business," adding that over "the last 5, 6 years, we've been investing aggressively in our R&D capabilities" and that recent skincare growth "has largely been due to the contribution of our R&D team in terms of better products" [34]. Product wins like Galénic's VB serum and DR.WU's PDRN serum are offered as proof [35].
The read
The product engine is genuine but sub-scale, and on the evidence it is doing the work of lifting gross margin — not the work of lowering the cost of a sale. A US$19.6 million research budget, flat since 2021 and dwarfed 20.8 to 1 by marketing, is enough to differentiate a premium serum and support 78% gross margins; it is not, on its face, the kind of proprietary product advantage that lets a brand pull back on customer acquisition. The premiumization case therefore rests more on brand-building and acquired labels than on a self-built research moat — a distinction that matters because the operating-margin gap sits almost entirely in the marketing line (Marketing Economics).
The strongest fact against this read is on the gross-margin line: the mix shift is working, and management has tied it explicitly to research-led products [36]. What would change the read is a step the filings have not yet shown: the research budget scaling in absolute terms alongside the skincare mix, invention patents overtaking design in the granted book, and — the input the corpus cannot supply — evidence that the higher "customer loyalty" management claims for skincare actually translates into a lower marketing bill per sale. Until then, the product story is real enough to defend pricing, and too small to escape the marketing model.
Valuation and Cash
The market pays almost nothing for Yatsen's brands — about 74% of its ~US$322m value is cash and securities, implying a 0.14-0.29x sales operating enterprise value — yet that floor is shrinking as operations burn ¥94.7m a year and is now outranked by US$120m of insider convertible notes whose year-three cash put can withdraw roughly the whole pre-deal net-cash pile.
At $3.43 an ADS, Yatsen's roughly $322 million market value sits against $145 million of net cash and a further $94 million of long-term investments — about three-quarters of the price is already on the balance sheet, leaving the operating business marked at roughly $84–177 million, or 0.14–0.29x sales, a fraction of what a profitable domestic peer commands. Of that ~$238 million headline floor, little reaches the common cleanly. The $120 million of senior convertible notes rank ahead, and their year-three cash put is close to the entire ~$145 million of pre-deal net cash; a further ¥721.5 million (~$103 million) of PRC-restricted net assets cannot be freely moved. Subtracting both leaves a conservative residual balance-sheet claim of roughly $15 million — about $0.16 per ADS against the $3.43 price. The counter is that these are claims and locks on the floor, not a solvency trigger: there is no bank debt, roughly 58% of the net cash sits at the offshore Cayman parent, the notes carry a 1.5% coupon, and the financing added cash rather than drained it.
The balance sheet inside the price
Yatsen's 1,877,236,043 ordinary shares are held as ADSs of 20 shares each, so the ~93.9 million ADS outstanding at $3.43 (28 July 2026) carry a market value near $322 million [1]. Against that price, the company held $109.4 million of cash and $35.2 million of short-term investments — $145 million of net cash, with no bank borrowings — plus $93.5 million of non-current investments, at 31 December 2025 [2].
Source: derived from the FY2025 Consolidated Balance Sheets and market data [3]; price of $3.43 as of 28 July 2026.
Strip out the cash and the operating business is valued at an enterprise value of about $177 million, or 0.29x the $614.6 million of FY2025 revenue [4]. Strip out the long-term investment portfolio as well and the residual falls to roughly $84 million — about 0.14x sales — for a business that turned over ¥4,298 million at a 78% gross margin. On that arithmetic the market assigns almost no value to the brands themselves; the price is close to the sum of the cash and the securities the company owns. Today the market prices the operating business at barely more than nothing.
The peer gap is a margin gap
Yatsen looks cheap only in relation to something. The nearest listed comparison is Proya, the largest domestic Chinese beauty group and the peer Yatsen's own competitive positioning most resembles — digital-first, mass-to-premium skincare and colour. Proya trades at about 2.3x sales and 16x earnings; Yatsen trades at roughly a fifth of that on sales.
Sources: Yatsen FY2025 20-F [5]; Proya FY2025 results as reported (data feed); multiples on market data at 28 July 2026.
The discount is not a mystery, and it is not obviously a mispricing. The two companies sell into the same market at similar gross margins, but Proya earns a 17.6% operating margin while Yatsen loses 4.3% at the operating line. The entire gap is the marketing bill — the same conclusion reached in Marketing Economics, where selling-and-marketing spend has held near two-thirds of revenue through the crash, the skincare pivot and the store closures. A buyer paying 0.29x sales for Yatsen versus 1.9x for Proya is compensated for the risk that Yatsen never closes that margin gap. Whether the discount is opportunity or trap is most sensitive to the S&M ratio rather than to the multiple.
One caution on the peer anchor: Proya is a useful yardstick for what a profitable version of this business earns, but it is not a growth comparison. Proya's own revenue was flat-to-down in 2025 (¥10.60 billion versus ¥10.78 billion the year before), so the 16x multiple prices a mature, high-margin compounder, not a re-accelerating one. Yatsen is growing faster (+26.7% in 2025) but from a loss.
Backing out a normalized margin
The cleaner way to read the price is to ask what operating profit would justify today's enterprise value. At an $177 million EV and a mid-teens EV/EBIT multiple typical of a low-growth consumer brand, the implied normalized operating profit is only about ¥85–125 million — roughly a 2–3% operating margin on current revenue. That is close to the thin non-GAAP breakeven Yatsen reached in 2025, and an order of magnitude below Proya's 17.6%.
Implied by EV (op margin)
FY2026 consensus (net margin)
Proya actual (op margin)
Source: derived from FY2025 enterprise value and revenue [6]; consensus and Proya figures as reported (single-analyst estimate; data feed).
A single sell-side estimate points the same way, and its thinness is worth stating plainly: one analyst models FY2026 revenue of ¥5,238 million (+21.9%) and earnings of ¥1.56 per ADS — about ¥146 million of net income, or a 2.8% net margin — rising to ¥3.01 per ADS in FY2027, with a $4.01 price target roughly 17% above the current quote. Even that lone constructive view has Yatsen reaching only low-single-digit margins, not peer-like ones. The valuation, in other words, does not require heroics: it needs the business to hold the slim profitability it has just touched. The upside case is that if margins travel even part of the way to Proya's, the earnings — and the equity — are worth a multiple of today; the downside case is that the low multiple reflects a margin gap the company has not yet closed.
What sits ahead of the cash
The net-cash cushion that makes the downside look protected is real but encumbered, and three facts qualify it.
First, the cash is still leaving. Operations consumed ¥94.7 million in FY2025 and free cash flow was negative ¥138 million; the burn has narrowed but not stopped, and it continued into 2026 [7]. At that rate the ¥1.0 billion of net cash funds many years of losses, so insolvency is not the near-term risk — value erosion is, as noted in Path to Breakeven.
Second, $120 million of insider convertible notes now rank ahead of the common. The notes carry a 1.5% coupon, convert at $4.63 per ADS, and give holders the right to require repayment for cash on the third anniversary at a 4% internal rate of return [8]. The proceeds add cash, so they do not destroy the cushion; but they subordinate it. In a wind-down the equity now sits behind roughly $120 million of senior insider claims — an amount close to the entire pre-deal net cash — and the cash put means part of that balance is pre-committed to leaving the company by year three. The full terms and the shareholder objection they provoked are in Control and Capital.
Source: FY2025 Consolidated Balance Sheets [9] and Note 23 subsequent-events disclosure [10].
Third, part of the cash is not freely accessible. As of 31 December 2025, ¥721.5 million of the group's net assets — held in its PRC subsidiaries and consolidated VIEs — were restricted from being paid out as dividends, loans or advances under Chinese law [11]. For a buyer treating the balance sheet as a floor, that trapped portion — roughly $103 million — is a genuine discount to the headline cash, and the broader China-listing overhang behind it is examined in China Structure.
What would change the read
The valuation is two-sided and the deciding variables are observable. The case for the discount as opportunity strengthens if the selling-and-marketing ratio finally steps down while revenue holds, which is what would convert 0.29x sales from a value trap into a cheap call on margin normalization. It weakens if S&M stays near two-thirds of revenue, because then the operating business earns nothing and the cash simply drains through it, one quarter at a time. The convertible adds a second dial: the terms on which the second tranche closes, and whether repayment is taken in cash at year three, determine how much of the balance-sheet cushion actually reaches equity holders. The multiple is not the argument; the margin and the claims ahead of the cash are.
Control and Capital
One person decides how Yatsen's remaining cash is used. Founder-CEO Jinfeng Huang holds about a third of the economics but 90.4% of the votes [1], so whether the IPO windfall is being returned faster than the business earns it depends on his stewardship. The record is mixed: ¥757m of acquired goodwill written off, US$202m of buybacks, and now a US$120m convertible from insiders that a large shareholder objected to before joining.
Who controls the company
Yatsen runs a dual-class structure. Class B shares carry twenty votes each and Class A shares one, and Huang owns every Class B share. On the company's own headline basis that leaves him with 32.0% of the economics and 90.4% of the vote, and makes Yatsen a "controlled company" under NYSE rules [2]. He is both Chairman and CEO, on a board of five directors, three of them independent [3].
Founder economic stake
Founder voting power
Directors & officers voting
Source: FY2025 Annual Report (Form 20-F), Item 3 Risk Factors [4] and Item 6.E Share Ownership [5].
The rest of the register is institutional. On the ownership table's basis — which strips out the treasury and incentive-trust shares and so reads the founder's stake a little higher, at 34.3% of shares and 90.7% of votes — the next two holders are early backers, not the public float: Hillhouse at 13.8% and ZhenFund at 11.9%, each with under 2% of the vote. CFO Donghao Yang, a former Vipshop finance chief, holds 4.4% [6].
Source: FY2025 Annual Report (Form 20-F), Item 6.E Share Ownership, beneficial ownership as of 28 Feb 2026 (excludes repurchased/trust shares from the base) [7].
The control has two edges. Because Huang holds more than half the vote, Yatsen may rely on NYSE exemptions from the requirements for a majority-independent board and independent nominating and compensation committees [8]. It has not taken the board exemption — three of five directors are independent — but the option, and the concentrated vote behind it, means minority holders cannot force an outcome the founder opposes. That matters most when the company transacts with the founder himself, as it now does.
What management is paid
Cash pay is small and, in the manner of a foreign private issuer, disclosed only in aggregate — individual amounts are not broken out. In 2025 the executive team was paid ¥7.5 million in cash plus ¥0.3 million of benefits, with US$0.2 million to the independent directors [9]. Aggregate cash pay has run between ¥7 million and ¥10 million a year — ¥7.1 million in 2023 [10] and ¥9.5 million in 2024 [11] — a rounding error against a company that has accumulated years of losses.
The compensation that matters is equity. Share-based compensation ran ¥77.5 million in 2023, ¥91.2 million in 2024 and ¥59.0 million in 2025, the decline tracking headcount reduction and front-loaded vesting [12]. Over three years that is roughly ¥228 million of stock granted — about ten times the cash payroll — and it dilutes the same shareholders the buybacks were shrinking.
Source: FY2023–FY2025 Annual Reports (Form 20-F), Item 6.B Compensation and Item 3 Risk Factors [13]; [14]; [15].
The read here is favourable to alignment. Huang is not extracting a large salary; he is paid, overwhelmingly, through a 32% ownership stake whose value has already fallen roughly 93% from the IPO (After the Crash). His incentive is the share price, not the payroll. The offset is disclosure: the aggregate-only format leaves an outside holder unable to see how pay splits between the founder and the professional managers around him, or how option strikes were set.
The capital-allocation record
The stewardship question is not about pay; it is about what has been done with the money. Yatsen raised US$577 million of net proceeds at its November 2020 IPO and earmarked part of it for "potential strategic investments and acquisitions" [16]. Those acquisitions — the premium skincare brands Eve Lom, DR.WU and Galénic — are the same ones whose economics Marketing Economics found have not yet lowered the marketing bill. On the balance sheet they left a larger mark: goodwill was written down by ¥354.0 million in 2023 and ¥403.1 million in 2024, ¥757 million in all, mostly against the Eve Lom unit as results came in below plan [17].
The second use of cash was buybacks. The program was enlarged three times — from US$100 million (2021) to US$150 million (2022) to US$200 million (2023) — and by February 2026 the company had repurchased 40.2 million ADSs for US$202.2 million [18]. That retired stock at depressed prices and cut the weighted share count from 2,195.8 million to 1,862.6 million, down 15% in two years [19]. It was also, as After the Crash established, larger than the cash operations burned over the same span. The most recent signal is caution: the May 2025 replacement program is capped at just US$30 million [20].
Sources: FY2025 Annual Report (Form 20-F) — buybacks and minority buyouts, Consolidated Statements of Cash Flows [21]; goodwill impairment [22]; Note 23 Subsequent Events [23]; IPO proceeds [24].
Read together, the record is neither reckless nor distinguished. The acquisitions were the clear misstep — roughly a fifth of the IPO haul now sits impaired. The buybacks were defensible: retiring shares below the company's own cash-per-share is accretive, and management scaled them back as the cushion thinned. Against that, ¥181 million was also spent buying out subsidiary minority interests [25]. The through-line's worry — capital leaving the business faster than it is earned — is visible in the M&A write-offs and the buyback pace, and only partly answered by the recent restraint.
The insider convertible
The newest capital action tests governance directly. On 11 March 2026 Yatsen agreed to sell about US$120 million of RMB-denominated convertible senior notes, in two equal tranches, to an investment vehicle affiliated with the private-equity firm Trustar Capital — a vehicle named Polaris Veristas Investment Limited — alongside founder Huang himself [26]. A net-cash, debt-free company was adding financing while still burning operating cash (Path to Breakeven), and doing it with its own controlling shareholder on the buy side.
Principal (US$M)
Coupon
Conversion (US$/ADS)
Source: FY2025 Annual Report (Form 20-F), Note 23 Subsequent Events [27].
The terms sit between debt and equity, and lean toward debt. The notes carry a 1.5% coupon, convert only after the first year at US$4.63 per ADS, and give holders the right to put them back to Yatsen for cash on the third anniversary at a price set to yield a 4% return [28]. The conversion price is about 35% above the US$3.43 the ADS traded at on 28 July 2026, so the insiders convert only if the stock climbs; otherwise they hold cheap, senior paper and can demand their money back with interest. Attached warrants, struck at US$10.00 per ADS, are a small long-shot kicker. If both tranches convert, they would create roughly 26 million new ADSs — about 28% more than the 94 million outstanding — so the dilution is real but contingent on a recovery that has not happened.
Watch item: a significant shareholder objected to the placement and pushed to take part in it, and the first tranche did not close on the original terms. Following the objection, Hillhouse — a 13.8% holder — joined the deal, and the first tranche completed on 21 May 2026.
Source: FY2025 Annual Report (Form 20-F), Note 23 Subsequent Events [29]; company news, 21 May 2026 [30].
That sequence shows how governance works here in practice. A related-party financing, arranged by a board the founder controls, drew a formal objection from a large outside shareholder who felt its interests were not protected — and the dispute was resolved not by changing the terms for everyone but by letting the objector, Hillhouse, buy in alongside the insiders [31][32]. The financing also changes the balance sheet: the US$120 million adds cash, but it ranks ahead of the common equity and carries a cash put, so the debt-free cushion that After the Crash valued now sits behind up to US$120 million of insider-held senior claims.
The read
On the evidence, alignment is genuine but control is close to absolute, and the two are now visibly in tension. Huang's 32% economic stake, modest cash pay, and willingness to put his own money into the convertible all point to an owner-operator whose incentives track other shareholders'. The offset is that he can act without their consent, the acquisitions he directed cost ¥757 million in write-downs, and the first financing that pitted his interests against a large minority holder was settled by admitting that holder to the same terms rather than by an arm's-length process.
The strongest fact against a benign reading is the objection itself: a sophisticated 13.8% owner looked at an insider deal and concluded it needed contesting. The strongest fact for one is that the deal is cheap capital — a 1.5% coupon and an above-market conversion price — from investors betting on the same recovery. What would move the read is concrete and checkable: the terms on which the second tranche closes and whether other minority holders get comparable access; any return to debt-funded, goodwill-heavy M&A; and whether the buyback restraint holds or the founder resumes returning cash while the business still burns it.
China Structure
The cash and securities that make up roughly three-quarters of Yatsen's market value are held inside a China-domiciled, VIE-topped structure, and their accessibility is uneven. The part that depends on unenforceable contracts — the consolidated VIE — carries only about 3% of revenue and 11% of assets, and a majority of the group's liquid cash already sits offshore at the Cayman parent. What is genuinely encumbered is ¥721.5 million of PRC net assets, a repatriation tax haircut, and the entire ¥653.6 million investment portfolio, most of it inside the VIE itself. The listing overhang has receded since 2022 but is re-assessed every year.
Where the business actually sits
Yatsen Holding Limited is a Cayman Islands holding company with no operations of its own; it reaches its China business through wholly-owned subsidiaries and, for one slice, through a variable interest entity it does not legally own but consolidates under U.S. GAAP as the primary beneficiary [1]. The distinction matters because control of that VIE rests on a set of contracts — a proxy agreement and powers of attorney, an equity pledge, an exclusive business cooperation agreement, and an exclusive call option — which, in the company's own words, "have not been tested in a court of law" [2].
The 20-F's condensed consolidating schedule shows how much of the business actually depends on those untested contracts. In FY2025, of ¥4,298 million of third-party revenue, the equity-owned entities — offshore and directly-held subsidiaries plus the wholly-foreign-owned enterprise (WFOE) — produced ¥4,166 million, or 96.9%. The VIE and its subsidiaries produced ¥132 million, or 3.1% [3].
Source: FY2025 Annual Report (Form 20-F), Financial Information Related to the VIE — condensed consolidating statement of income [4].
The same split runs through the balance sheet: the VIE and its subsidiaries hold ¥421.9 million of the group's ¥3,847 million of total assets (11.0%), and just ¥10.4 million of cash [5]. For a professional investor sizing the structural risk, the read is most sensitive to this split. A Chinese internet or education company typically parks a licensing-gated business — sometimes most of its revenue — inside the VIE, so a legal challenge to the contracts threatens the whole enterprise. At Yatsen the beauty operations are overwhelmingly held through equity, and the VIE is a small residual. A disallowance of the VIE structure would still be damaging, but it would put a low-single-digit share of revenue directly at risk, not the business.
VIE share of revenue
VIE share of assets
Cash held in the VIE (¥M)
Source: derived from the FY2025 condensed consolidating schedules [6] [7].
The contracts themselves were re-executed recently. The proxy agreement and powers of attorney, the equity pledge, and the exclusive call option were all filed as "Third Amended and Restated" agreements dated December 1, 2025, alongside a fresh spousal-consent letter from the VIE shareholder's spouse; only the 2019 exclusive business cooperation agreement was left unamended [8]. A refresh of the pledge and option documents is routine housekeeping that keeps the contractual claim current; it does not make the arrangement any more enforceable in a PRC court than it was, but it does show the structure is being actively maintained rather than left to drift.
The cost of moving money up the chain
Because the VIE is not owned, cash reaches the parent only as service fees paid to the WFOE, and none have been paid: for each of 2023, 2024 and 2025, the VIE paid no service fees to the WFOE [9]. That is a small matter today only because the VIE holds so little cash. Where earnings do have to travel up from inside China, the tax leakage is real: the 20-F's own worked example takes ¥100 of pre-tax VIE earnings down to about ¥71 after a 25% enterprise income tax and a 5% treaty withholding, and to roughly ¥53 in the worst case where the intercompany fee structure is disallowed and the transfer is taxed twice [10]. Renminbi is not freely convertible, so currency controls sit on top of the tax [11].
The reassuring counterweight is where the liquid money already is. Of the group's ¥1,011 million of cash and short-term investments at year-end, the Cayman parent alone held ¥338.5 million of cash and all ¥246.0 million of short-term investments — ¥584.5 million, or 58%, sitting offshore and outside PRC transfer restrictions [12]. This is the residue of the 2020 IPO proceeds, which flowed into the holding company and never had to be routed into China. The net-cash floor that the valuation (Valuation and Cash) leans on is therefore more accessible than a "China-domiciled cash" label implies — the majority of it never entered the tax-and-controls maze at all.
Source: FY2025 condensed consolidating balance sheet; parent figure combines ¥338.5M cash and ¥246.0M short-term investments [13].
That offshore majority has, if anything, become more accessible over time. The share of the group's cash held in China climbed to a 50.2% peak at the end of 2023, as the offshore IPO proceeds were drawn down for buybacks, then receded to 28.5% by the end of 2025 [14] [15] — a reversal of the drift that had carried it from 12.8% at the 2020 IPO toward half the balance [16].
Source: liquidity disclosure, FY2025 20-F [17], the FY2023 peak [18] and the IPO prospectus [19]; intervening years from the FY2021, FY2022 and FY2024 20-Fs.
The part of the floor that does not travel as easily is the investment portfolio. The ¥653.6 million of long-term investments that the valuation counted as roughly a quarter of the balance-sheet value sits entirely inside China — ¥365.7 million of it, or 56%, inside the VIE, with the rest in the WFOE and other subsidiaries; none is held offshore [20]. For a bankruptcy-averse buyer counting the securities as part of the margin of safety, that portfolio is the least accessible piece: China-located, majority-held in the contractually-controlled entity, and — as the valuation chapter flagged — of uncertain realizability at carrying value.
Statute puts a ceiling on the strictly trapped amount. Under PRC law the group's PRC entities and the VIE's subsidiary can only distribute out of retained earnings and must first appropriate 10% of after-tax profit to a statutory reserve; the portion of their net assets that cannot be moved up as dividends, loans or advances was ¥721.5 million at year-end [21]. That is 24% of the ¥2,999 million of consolidated equity — just under the 25% threshold at which Regulation S-X would force separate parent-only financial statements, which the company confirms it did not cross [22].
Sources: FY2025 condensed consolidating balance sheet [23]; Note 24, Restricted Net Assets [24]. The restricted-net-assets figure is an equity measure, shown as a memo line, not additive to the two asset lines above.
Set against the ¥584.5 million already offshore, the picture is calibrated rather than alarming: the cash a shareholder is implicitly counting on is mostly out of China; the securities largely are not. The offset is that the same offshore cash is also the pool from which the insider convertible's year-three cash put (Control and Capital) would be satisfied without any PRC friction — accessible cash is accessible to the senior claimants first.
The listing overhang
Yatsen carries the standard set of China-ADR jurisdiction risks, and they are currently dormant rather than absent. Its auditor, PricewaterhouseCoopers Zhong Tian LLP [25], is located in mainland China [26] and its audit report carries PCAOB ID 1424 [27]. Under the Holding Foreign Companies Accountable Act the company was conclusively listed as a Commission-Identified Issuer in May 2022, after the PCAOB's December 2021 finding that it could not inspect mainland audit firms; the PCAOB vacated that determination on December 15, 2022, and Yatsen does not expect to be identified again on the current annual report [28]. The trading prohibition bites only after two consecutive identifications, so the acute delisting path that was live in 2022 has been cleared — but the PCAOB re-assesses access every year, and a renewed loss of access would reopen it [29].
The delisting scares in the record are two different things. The 2022 and 2023 NYSE notices covered in After the Crash were price-driven — the ADSs had fallen below the exchange's $1.00 minimum and were cured, the second time by the 4-to-20 ADS ratio change. The HFCAA path is jurisdiction-driven, turns on audit-inspection access rather than share price, and is presently inactive.
On the securities-regulation side, Yatsen qualifies as an already-listed "Stock Enterprise" under the CSRC's New Overseas Listing Rules that took effect in March 2023, so it is not required to file for its existing listing — but it must file with the CSRC if it undertakes refinancing, with fines of ¥1 million to ¥10 million for a missed filing [30]. That is not hypothetical: the roughly US$120 million insider convertible (Control and Capital) — RMB-denominated notes issued to a Trustar Capital vehicle and the founder — depends on Yatsen obtaining a foreign-debt registration certificate from the NDRC before its first note extends from 364 days to five years [31], so the financing already runs through the PRC cross-border-capital approval machinery. On data, the company states it is not required to undergo a Cyberspace Administration cybersecurity review, a conclusion its PRC counsel re-confirmed by consultation in February 2026 [32].
What would change this read
On the evidence, the China structure qualifies the net-cash floor without hollowing it out. The genuinely fragile element — the untested VIE contracts — governs about 3% of revenue and 11% of assets; the majority of the liquid cash is already offshore; the strictly trapped amount is a bounded ¥721.5 million of net assets plus a repatriation tax that only bites cash forced up from inside China. The offset is that the investment portfolio and a real slice of consolidated equity remain China-locked, most of the portfolio inside the VIE, and the listing risk, while dormant, remains subject to annual PCAOB re-assessment.
Three things would move the read. A renewed PCAOB loss of access to mainland audit firms would restart the HFCAA clock and reintroduce a hard delisting path within two filing cycles. A PRC challenge to, or a shareholder default under, the December 2025 VIE contracts would test enforceability for the first time — though on a small revenue base. And any scenario in which Yatsen needed to pull the China-side cash or investments back offshore — to fund the cash put, a buyback, or a distribution — would surface the tax-and-controls haircut that the offshore IPO balance has so far let it avoid.
Investment Portfolio
Beyond its net cash, Yatsen carries ¥653.6 million (US$93.5 million, roughly 29% of market cap) of long-term investments — the least-examined leg of its asset floor. Opened up, it is sounder than its opacity implies: ¥581.1 million, or 89%, is equity-method stakes in five private companies that together earned ¥140.0 million in 2025 and paid Yatsen its first cash dividends [1] [2]. The offset is location: none of it sits offshore, and 56% is held inside the variable-interest entity [3].
The valuation floor and the China structure both counted this ¥653.6 million but left it as one line. This chapter examines it — what the money is invested in, whether the assets are earning, and how reachable they are from a New York-listed share.
What the ¥653.6 million is
The investment note splits into three unequal legs. Equity-method stakes in five private entities dominate at ¥581.1 million. A second ¥72.5 million sits in two more private companies held at cost because they have no readily determinable fair value. The third leg — available-for-sale debt of two private issuers — was written to zero in 2025 [4].
Portfolio (¥M)
Portfolio (US$M)
Share of Market Cap
Source: FY2025 Annual Report (Form 20-F), Note 8 Investments and Consolidated Balance Sheet [5] [6]; market cap at $3.43 on 28 Jul 2026.
Source: FY2025 Annual Report (Form 20-F), Note 8 Investments [7].
The book has stopped growing and started returning cash. Yatsen put ¥121.5 million into equity investments in 2023 and ¥42.0 million in 2024, then nothing in 2025 [8]. Over the same span the carrying value of the equity-method leg barely moved — ¥532.3 million (2023), ¥576.9 million (2024), ¥581.1 million (2025) — as retained earnings and the first distributions roughly offset [9] [10].
Source: FY2024 and FY2025 Annual Reports (Form 20-F), Note 8 Investments [11] [12].
The biggest leg is backed by profitable businesses
The equity-method stakes are the part of the book with real disclosure behind it. Because they met the significance test in Rule 4-08(g) of Regulation S-X, the filing carries combined financial statements for all five investees. Together they held ¥3.30 billion of net assets at the end of 2025 and turned ¥597.2 million of revenue into ¥140.0 million of net income — a 23.4% net margin, and the third straight year of nine-figure profit [13].
Source: FY2025 Annual Report (Form 20-F), Note 8 Investments — Rule 4-08(g) combined financial information [14].
Two facts matter more than the profit itself. First, in 2025 the portfolio returned cash for the first time: Yatsen collected ¥11.1 million of dividends from these investees, having received none in 2023 or 2024 [15]. That is the first hard evidence the carrying value converts to something other than an accounting entry. Second, the dividend exceeded the ¥5.9 million Yatsen booked as its share of the investees' earnings that year [16].
That ¥5.9 million recognized share is the important qualifier on all of the above. Set against the investees' combined ¥140.0 million of net income, it says Yatsen's economic interest in the profitable pool is a modest slice, not a near-controlling one — so the combined statements establish that the underlying businesses are real, earning, and asset-rich, but they cannot be used to value Yatsen's specific stakes, and they neither confirm nor refute that ¥581.1 million is the right mark. The combined balance sheet is also asset-heavy for its revenue — ¥3.07 billion of non-current assets against ¥597.2 million of sales — consistent with at least one investee being itself an investment-holding vehicle rather than a pure operating company [17].
The soft edges
The two smaller legs are where the disclosure thins and the impairments land. The ¥72.5 million of cost-basis stakes carry no observable price and no earnings disclosure; they are marked at cost unless an impairment or an observable transaction forces a change. The available-for-sale debt leg shows how that mechanism plays out: convertible notes and preferred shares of two private issuers, carried around ¥13.4 million for years, were fully impaired in 2025 — a ¥13.5 million charge that took the balance to nil [18] [19].
The write-down is small against the ¥653.6 million total, but it shows that management does mark these private positions down when the evidence turns, and both the debt leg and the cost-basis leg sit in Level 3 of the fair-value hierarchy, valued on unobservable inputs [20]. The 11% of the book outside the equity-method stakes is the part a buyer would haircut first.
Where the assets sit
The quality of the biggest leg runs into the same wall as the rest of Yatsen's balance sheet: geography. The consolidating schedule places the entire ¥653.6 million onshore in China. Not one renminbi is held at the Cayman parent that sits above the listed shares. ¥365.7 million — 56% — is held inside the VIE and its subsidiaries, with ¥183.7 million in the primary-beneficiary WFOE and ¥104.1 million in other onshore subsidiaries [21].
Source: FY2025 Annual Report (Form 20-F), condensed consolidating schedule [22].
This is the same repatriation friction the China structure chapter traced for the cash: getting value from these investments to an offshore shareholder means routing distributions up through the WFOE and out of China, against the renminbi's limited convertibility. The portfolio adds its own tax drag — the deferred tax liability booked on the equity-method investees' undistributed earnings rose to ¥19.2 million in 2025 from ¥10.6 million a year earlier, the tax that would attach as those earnings are pulled out [23]. The ¥11.1 million dividend shows the channel works; the geography sets what a conservative mark should be.
The read
For an investor sizing the asset floor, the investment book is a modest positive that comes with a discount. The evidence for the positive is specific: the 89% of the portfolio that matters is staked in businesses earning a 23% net margin on ¥3.3 billion of net assets, and 2025 was the first year those stakes paid cash back. That is a better answer than "unmarked private holdings" to the question of what backs the ¥653.6 million. The strongest fact against reading it at par is also specific: Yatsen's recognized share of the investees' profit is only ¥5.9 million, the two smaller legs are Level 3 marks that management has already begun writing down, and every asset sits onshore with 56% inside the VIE — so in any liquidation-style net-asset view the book belongs at a discount to carrying value, not at face. What would move the mark either way is disclosure the filings do not yet give: the identity and size of the individual stakes, a further impairment, or a realization event — a stake sale or a larger distribution — that prices even one of them at arm's length.
Examined in detail, the ¥653.6 million investment book is better-quality than an unmarked line suggests: 89% is equity-method stakes in profitable private companies that paid their first cash dividend in 2025. But it is 100% onshore and 56% inside the VIE, so it should carry a discount to carrying value in any asset-floor estimate rather than sit at par.
What to Watch
The six prior chapters resolve into two coherent readings of the same company, and the evidence does not yet decide between them: a cheap, cash-backed premiumization story approaching self-funding profit, or a structurally loss-making marketing model slowly spending its IPO windfall. Both are built from the same filings. What separates them is chiefly the marketing bill and a few line items that will move over the next several reports. This chapter reconciles the two and sets out what to watch.
Two readings of the same numbers
The constructive read has real support. Gross margin reached 78.2% in 2025, up from 77.1%, as higher-margin skincare took over the mix [1]. Skincare became the larger segment for the first time, at 53.0% of revenue against color cosmetics' 46.7% [2], and it grew 58.5% again in the first quarter of 2026 as group revenue rose 22.5% [3]. The company posted its first full-year non-GAAP net income (¥8.4 million) and its first quarterly GAAP net profit (¥3.0 million in the seasonal fourth quarter) in 2025 [4]. Against roughly $145 million of net cash and no debt (Valuation and Cash), the market pays almost nothing for the operating brands.
The skeptical read uses the same statements. The 2025 non-GAAP profit is a 0.2% margin resting on roughly ¥100 million of non-cash add-backs; on a GAAP basis the operating line still lost ¥185.8 million (−4.3% of revenue) [5]. Selling and marketing ran ¥2.85 billion, 66.3% of revenue, and has sat in a narrow band near two-thirds of sales for six years through the crash, the category pivot, and hundreds of store closures (Marketing Economics) [6]. The moment the company paid to grow in the first quarter of 2026, the operating loss more than doubled to ¥99.0 million (−9.7% of revenue) [7]. Full-year operations burned ¥94.7 million, and even the profitable fourth quarter still used cash — though not every quarter did: the first quarter of 2025 was cash-generative [8].
Neither read is a strawman. The disagreement is not about the facts but about whether the marketing ratio is a fixed cost of a rented audience or a number that premiumization will bring down with a lag.
Where the two readings collide
Each row below is a fact both sides accept, read two ways, with the evidence that would settle it.
Sources: FY2025 20-F MD&A and notes [9][10]; Q4 FY2025 and Q1 FY2026 results [11][12].
Four of the five rows resolve through the same channel: the trajectory of the marketing ratio and the operating cash it frees or consumes. The case is most sensitive to that one line, which is why the watch-list below is built around it rather than around revenue growth, where the company has already delivered.
What today's price implies
At $3.43 on 28 July 2026, the market marks Yatsen's operating business at roughly a sixth to a third of one year's sales once the cash and securities are stripped out — a fraction of the ~1.9x EV/sales a profitable domestic peer commands, and a price consistent with only a ~2–3% normalized operating margin (Valuation and Cash). The gap between the two readings is therefore the gap between a business that stays near breakeven and one that converts its 78% gross margin into a peer-like operating margin. The chart frames that span against where the company actually sits today and where the peer sits.
Sources: FY2025 and Q1 FY2026 operating margin as reported [13][14]; "priced-in" and "mix lowers marketing" are illustrative scenarios, not forecasts; Proya per competitor financials, as reported (Marketing Economics).
The marketing line is the whole story: at 66.3% of revenue it is both the ~22-point operating-margin gap to profitable peer Proya and the ~¥900m swing between value trap and re-rating on ~¥5.5bn of sales, while Yatsen spends about 21 times as much on marketing as on R&D — so the step-down the upside depends on has no product moat visibly behind it. On roughly ¥5.5 billion of revenue — near the single-analyst 2026–2027 consensus — the distance between the −5% margin of a still-heavy marketing model and the +12% of a mix that pulls S&M toward the high-50s is about ¥900 million of operating profit, which is why the same balance sheet supports both a value-trap read and a multiple-of-today read. Management states in the 20-F that it "intend[s] to continue optimizing this ratio by reallocating marketing spending toward higher-return channels" and "capturing operating leverage across our fixed expenses" [15]; it has not attached a number or a date to that intent, and guides revenue only.
The watch-list
Each item names the line, the filing it appears in, and the threshold that would move the read from one column of the tension table to the other. The nearest read is close: the second-quarter results are scheduled for 20 August 2026.
Sources: guidance and cash-flow figures per Q1 FY2026 and FY2025 results [16][17]; convertible and restricted-assets terms per FY2025 20-F notes [18][19]; next-earnings date per company calendar.
The market pays almost nothing for Yatsen's brands — about 74% of its ~US$322m value is cash and securities, implying a 0.14-0.29x sales operating enterprise value — yet that floor is shrinking as operations burn ¥94.7m a year and is now outranked by US$120m of insider convertible notes whose year-three cash put can withdraw roughly the whole pre-deal net-cash pile (Valuation and Cash). That convertible carries two distinct clocks that are easy to conflate. The First Note has a 364-day maturity that extends to five years only on receipt of the NDRC foreign-debt registration certificate [20]; absent the certificate, a $60 million refinancing question lands within a year. The year-three cash put is exercisable at a 4% internal rate of return (Control and Capital). And ¥721.5 million of net assets remain restricted from upstreaming under PRC law, just under the SEC's 25%-of-equity threshold [21]. None of these is an insolvency trigger for a debt-light company; each is a claim on, or a lock on, the cash floor the cheapness rests on.
Base rates and positioning
Two features of the setup temper how much any single data point should move the read. First, the shares are thinly covered and thinly traded — effectively one analyst carries the consensus (2026 revenue ¥5,238 million, a $4.01 target), so estimate revisions are one modeler's view rather than a market signal, and the stock has drifted from $3.89 in March to $3.43 in late July within a 52-week range of about $2.19 to $3.89. Second, the earnings-surprise record is volatile and has skewed negative: reported results have missed the (sparse) EPS estimates by wide margins in several past quarters. A single better-looking quarter, especially the seasonally strong fourth, should be weighed against that base rate before it is read as the inflection.
Sources: analyst coverage, price history and earnings-surprise record per market data feeds, as reported.
Whether the stabilization proves durable resolves along the watch-list above rather than in any figure already filed: the balance sheet answers the downside, and the marketing line, quarter by quarter, will answer the rest.